Contents of Article
- Summary
- How is GPS technology used in sport?
- What are GPS units?
- What is the Tri-axial Accelerometer?
- What is the gyroscope?
- What is the magnetometer?
- What are heart rate monitors?
- Is wearable technology valid and reliable?
- Are wearables better than iPhones?
- Conclusion
- Recommended further reading
- References
- About the Author
Summary
The use of global positioning systems (GPS), or more appropriately named ‘wearable technology’, in high-performance sport is becoming increasingly popular despite having a considerable price tag. As this technology is not only very expensive but is also heavily contributing towards the inclusion and exclusion of athletes from training and competition, the validity and reliability of these devices is significantly important.
Whilst GPS units have been shown to possess reasonable reliability when measuring long distances at slow-moderate speeds, they tend to struggle during short-distance, high-speed movements – particularly during rapid randomised directional changes.
The tri-axial accelerometer appears to be a valid and reliable measure for quantifying acceleration forces in three perpendicular planes (x, y, and z). However, the use of the “Player/Body Load” value seems questionable due to the potential non-inclusion of rotational force data from the gyroscope, which may, therefore, underestimate sport-specific movements such as: tackling, jumping, and blocking. In support of this issue, movement classification has been shown to improve by 2-14% when the gyroscope data is combined with the accelerometer data.
Despite this, at least to our knowledge, no evidence supports the validity and/or reliability of the gyroscope, magnetometer, or heart rate monitor. All in all, these devices may be no better at monitoring performance than the equipment included within a typical smartphone (e.g. iPhone). This should not necessarily discredit their quality, as the equipment within both the wearables and the iPhone ‘may’ be highly sophisticated and accurate, though there is limited evidence to support their efficacy.
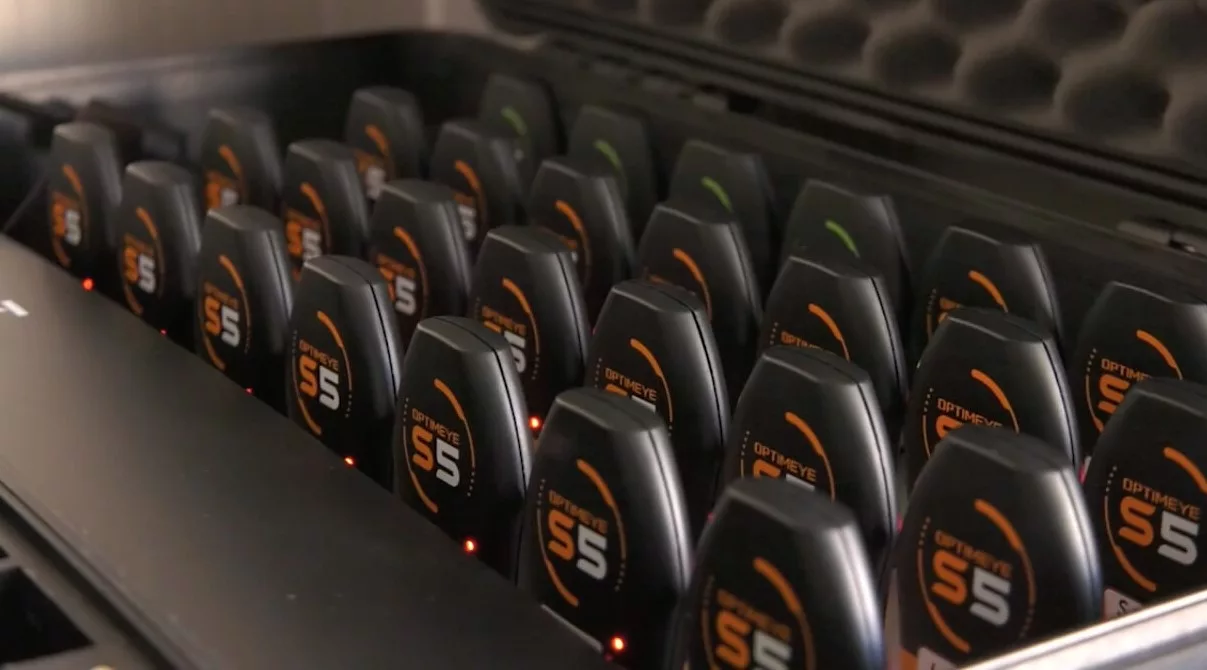
How is GPS technology used in sport?
Global positioning system (GPS) units are a satellite-based navigational technology that has been used profoundly in professional sports in since its introduction in 1997 (1). This technology is currently being used to provide sport scientists, strength and conditioning specialists, performance analysts, and coaches with real-time and post-match analysis of the athlete(s) practice or competition-based performances.
Whilst GPS is most commonly used in team sports such as football (soccer) (2-6), rugby league (7-10), rugby union (11-16), Australian rules Football (AFL) (17-22), hockey (23-25), netball (26), and lacrosse (27), it has also been used in individual sports – namely, tennis (28) and cycling (29), and ski jumping (30, 31).
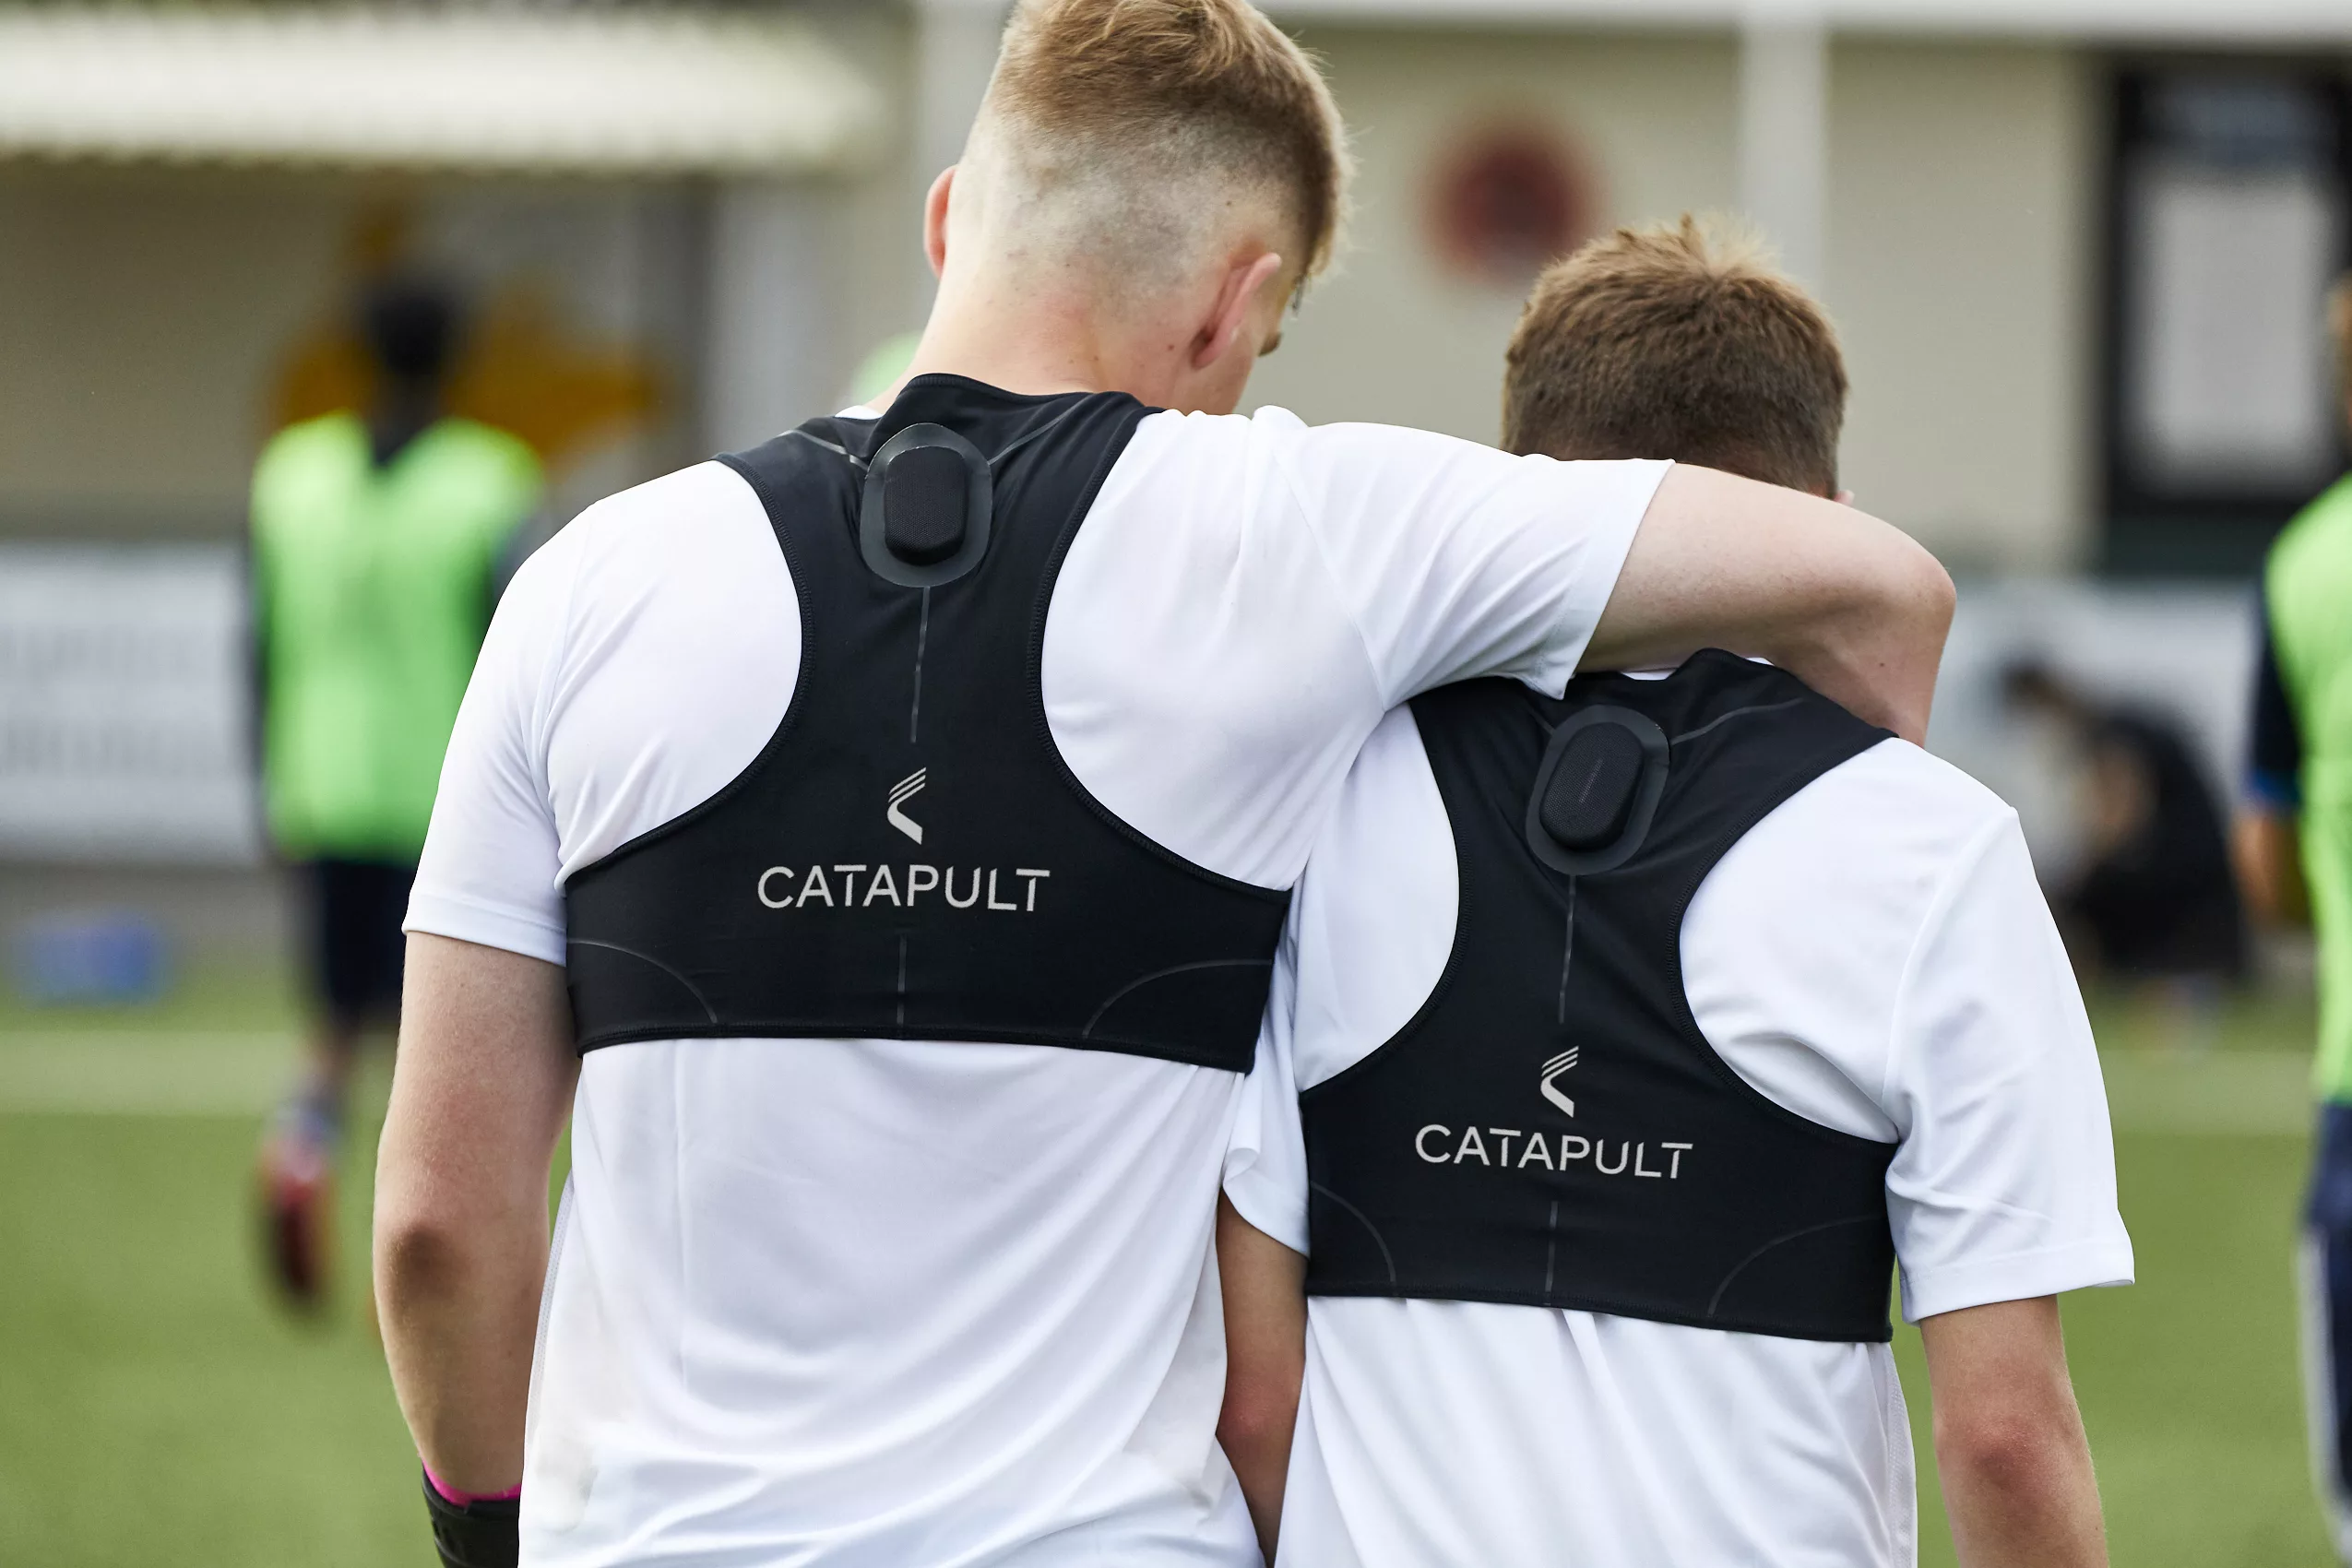
In recent years, additional micro-sensors (accelerometers, gyroscopes, magnetometers, and heart rate monitors) have also been included inside the conventional GPS units that are worn by athletes. These little units are now multifaceted devices that possess additional technology other than just GPS. In other words, those little wearable devices now often contain all the following technology:
- GPS unit
- 3-Dimensional Accelerometer (i.e. tri-axial accelerometer)
- 3-Dimensional Gyroscope
- Magnetometer
- Heart rate monitor
As a result, perhaps simply referring to these devices as GPS units is slightly outdated, and a more accurate name such as ‘wearable technology’, or ‘wearables’ is more appropriate – though this is just a matter of semantics. What is important, however, is understanding how these devices work, and whether or not they provide valid and reliable data that can be used to influence athletic performance. This article will, therefore, provide a step-by-step guide on these devices, and then discuss their efficacy for monitoring athletic performance.
What are GPS units?
As a quick introductory note, GPS units are occasionally referred to as ‘Data Loggers’. The GPS technology located inside these units is used by sports coaching staff to track the locomotive movements of athletes during both training and competition. In fact, GPS technology has been used extensively to document the physical locomotive movement demands of many team sports (32, 33). Using the data fed back from the GPS units, the computer will log the following locomotive variables:
- Velocity (m/s)
- Accelerations and Decelerations (m/s)
- Changes of direction
- Distance (m)
This information will then be extrapolated into various work-rate patterns and physical workload variables on a computer, but this will be discussed in further detail in Part 2 of this two-part review on wearable technology.
How GPS units measure player movement
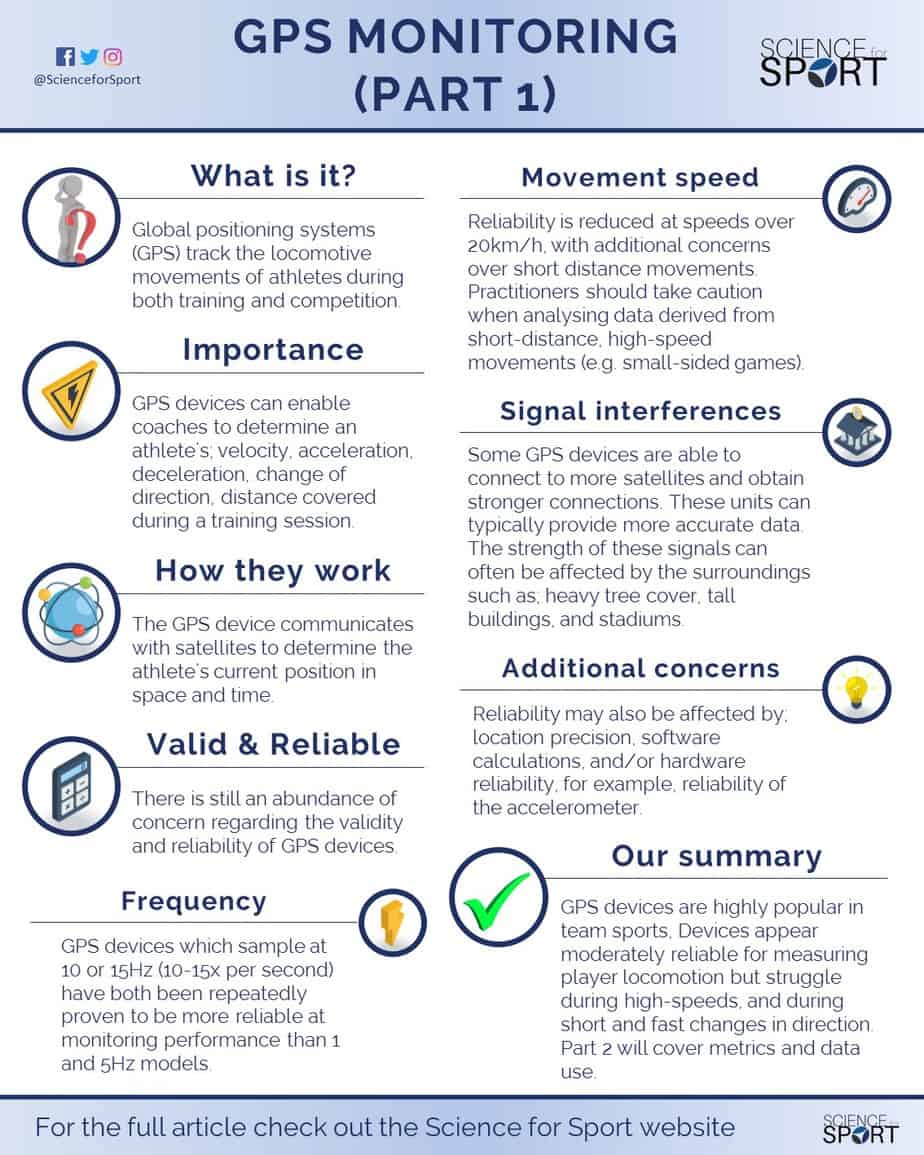
As GPS units use satellite-based technology, they operate by transferring data between the unit located on the athlete, and the available satellites orbiting the Earth (34, 35). This information/data is transferred using a sampling frequency* measured in Hertz (Hz). Meaning, the higher the sampling frequency, the more information transferred per second, thus theoretically resulting in a more accurate GPS unit. Although sampling frequency plays a large part in the accuracy/reliability of the GPS unit, other factors must also be considered: such as the number of available and connected satellites (32).
*The sample frequency is simply the number of sample signals that are obtained per second (1-second), or in other words, how often the unit recalculates and reports its position. For example, a 1 Hz unit will only obtain one sample per second, and in theory is therefore less accurate than a 10 Hz unit, which will report its position 10 times per second.
The communication between the GPS unit and the satellites allows it to calculate its current position in space and time (i.e. the unit’s latitude and longitude on Earth). This means that as soon as the athlete begins to move, the satellites can track the athlete’s movements 10 times per second when using a 10 Hz unit, or 1 time per second in a 1 Hz model. The GPS units typically used in clinical practice and sports science research are often one of the four sampling frequencies:
- 1 Hz
- 5 Hz
- 10 Hz
- 15 Hz
Over the past several years significant amounts of research has been conducted on the reliability of GPS units using these four different sampling frequencies. For the most part, continuous research identifies that with higher sampling frequencies comes greater reliability (32) – meaning 10 and 15 Hz GPS units are typically more accurate and reliable than their 1 and 5 Hz counterparts. Interestingly though, this is not always the case when assessing the reliability between 10 and 15 Hz models. More details on this will be discussed in the ‘Validity and Reliability of Wearable Technology’ section below.

What is the Tri-axial Accelerometer?
Wearable technology, or GPS units, are now commonly fitted with a piezo-electrical tri-axial accelerometer (36). This device has been incorporated in an attempt to record data on sport-specific movements such as tackling and collisions in rugby (37). Therefore, this is the device that records and reports player impacts, collisions, and is used to calculate ‘Player/Body Load’, and the ‘Dynamic Stress Load’ amongst others (33).
This technology is realistically nothing new and has been used in the past to detect common human movements in the general population such as sleeping, sitting, lying, walking, running, and jumping (38, 39). In fact, this technology is in-built into common smartphones (e.g. iPhones) and is, in essence, the same device used to monitor sleep patterns in common applications available in the App store (e.g. Sleep Cycle [40]).
An accelerometer calculates acceleration in meters per second squared (m/s), or in G-forces (g). A single G-force for us here on planet Earth is equivalent to the pulling force of gravity (9.81m/s). As an accelerometer only measures acceleration, once acceleration becomes constant, or in other words reaches zero, then the device records zero. Purely for example purposes, imagine a 100m sprinter achieving maximal velocity. Though they may be moving at approximately 40km/h (maximal velocity), their forward acceleration may read zero. This is an important concept to understand when learning what an accelerometer can, and cannot, do.
The tri-axial accelerometer produces data by recording the total amount of accelerations in three perpendicular axes (x, y, and z) – these are medial-lateral, anterior-posterior, and vertical. By measuring the frequency and magnitude of these movements (i.e. how often they occur and how big they are), the accelerometer is able to calculate the total ‘G-forces’ the athlete is exposed to, otherwise known as the ‘composite vector magnitude’ (33, 41). The total G-forces experienced by the athlete during each “collision” or “impact” are then categorised into different intensities/zones – this will be discussed in further detail in ‘Part 2 – Variables and Application’.
The video below provides a quick and simple demonstration of how a piezo-electrical tri-axial accelerometer actually works. Though it is important to understand that the accelerometers incorporated in the ‘wearable technology’ are much smaller and ‘potentially’ more technologically advanced.
Though this information may seem overcomplicated, it is vital the sports scientist understands this in order to comprehend the issues with this micro-sensor (i.e. device), and why there is a need for additional micro-sensors.
What is the gyroscope?
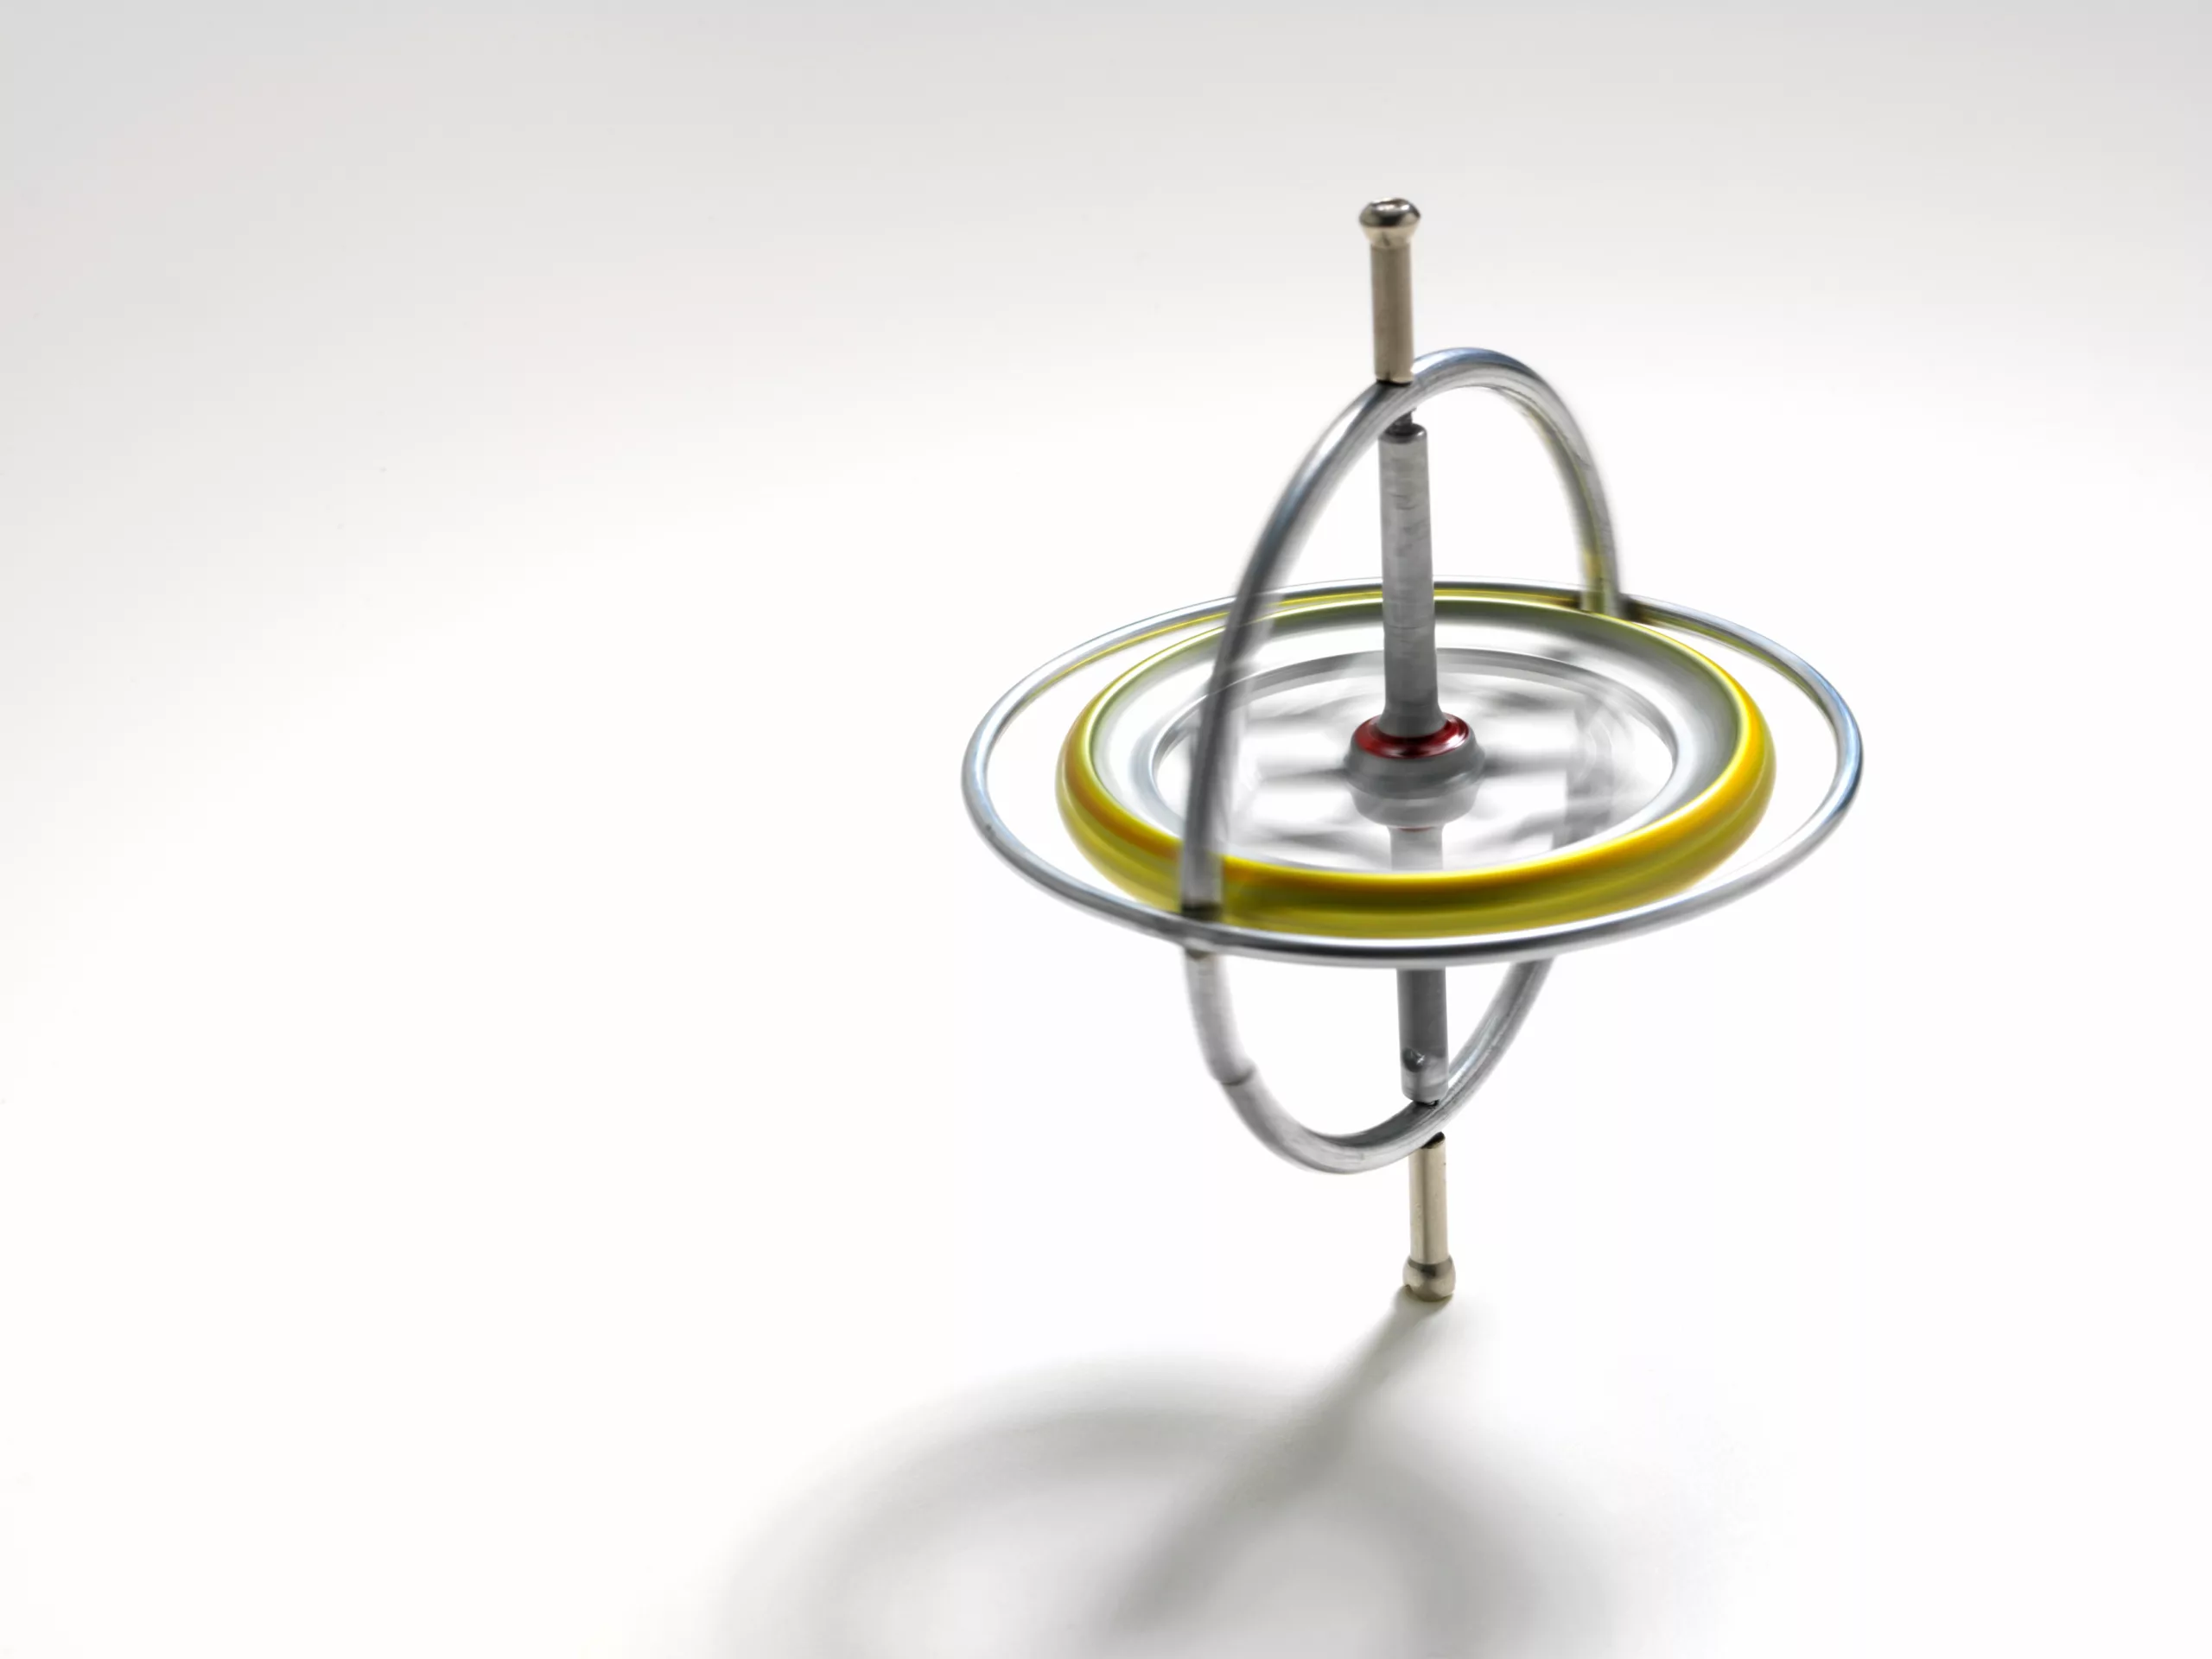
A gyroscope is a device that uses Earth’s gravity to help determine its orientation. The design of a traditional gyroscope consists of a freely-rotating disk called a rotor, mounted onto a spinning axis in the centre of a larger and more stable wheel. As the axis turns, the rotor remains stationary to indicate the Earth’s central gravitational pull, or put simply for us on Earth, which way is ‘down’. Figure 1 displays a traditional gyroscope, though this is very different to those included in the wearable technology, most people are familiar with this device and thus gain a better appreciation for how this sensor works.
So why is this one of the micro-sensors?
Recall previously that the tri-axial accelerometer can measure vectors in three different perpendicular planes (x, y, and z). Whilst this is very useful, it does not have the ability to measure angular acceleration. In other words, a tri-axial accelerometer cannot detect rotation or tilt, but the gyroscope can.
For another example, whilst an accelerometer can detect an athlete’s movements in the medial-lateral/frontal (x), anterior-posterior/sagittal (z), and vertical (y) planes of motion, it cannot detect any movements in the rotational/transverse plane. As a result, this is where the gyroscope plays its part, this micro-sensor is able to estimate rotational acceleration, and thus potentially enhance the detection of collisions (42).
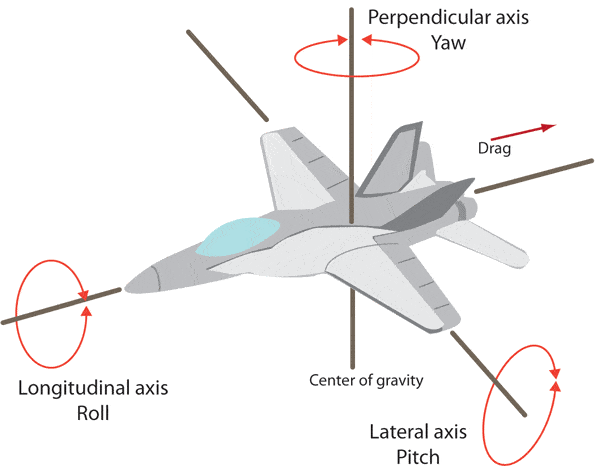
To make things slightly more complicated, the gyroscopes incorporated into the wearables measure 3-dimensional rotation. However, do not be too concerned as this is actually relatively straightforward, and Figure 2 demonstrates this nicely.
Three-dimensional gyroscopes measure rotational acceleration in three axis, these are:
- Pitch
- Roll
- Yaw
Whilst pitch measures rotation in the perpendicular axis, roll measures rotation in the longitudinal axis, and yaw measures rotation in the lateral axis. Collectively measuring rotational forces using a three-dimensional gyroscope, allows the wearable units to calculate rotational accelerations in all three axes during sport-specific movements such as swimming strokes and turns, kicking in team sports, and tackling in contact sports.
So essentially, the gyroscopes included in these wearable devices provide vital information about the body’s (athlete’s) rotational movement in space. This data is supposedly then used in the algorithms when calculating sport-specific movements such as tackles and collisions.
What is the magnetometer?
In simple terms, a magnetometer is just an electronic compass. This micro-sensor is able to detect “true” north using the Earth’s magnetic pulse. These sensors technically have two axes: “true” north (y), and east (x). However, because it can determine “true” north and east, its centre can, in fact, determine its orientation – that being is the unit facing ‘upwards’, or ‘downwards’. In other words, as these devices have two axes, with one identifying “true” north, they can determine the orientation of the body (athlete) in space. For example, when the athlete has fallen over, or is lying face down on the floor, the magnetometer can provide data on the orientation of the athlete (i.e. face down or face up).
Quite simply, the magnetometers are incorporated into the wearables in combination with the GPS unit to determine the athlete’s position/orientation on Earth, and which direction they are facing and/or moving. This is particularly important when coaches are using real-time analysis and want to track their athletes’ movements on a digital field on the computer – which can also then be extrapolated into heat map graphs.
What are heart rate monitors?
These devices are realistically nothing complicated, and are seldom transparent, unlike the previous micro-sensors discussed. These micro-sensors are simply programmed to receive and record the heart rate data collected by the heart rate belts wrapped around the athlete’s chest. This data is stored on the wearable micro-unit and then fed into the computer once connected via the docking station.
Is wearable technology valid and reliable?
Although the use of wearable technology in sports is a novel concept and one that is highly regarded at present within most professional environments, there is still an abundance of concern regarding the validity and reliability of the equipment. For sales purposes these concerns are often deflected, leading to misinformed professionals, or perhaps there is even naivety amongst sports scientists regarding the magnitude of these issues. Regardless, the aim of this section is to highlight some of these underlying problems that should be fully understood.
GPS Units (i.e. Data Loggers)
Sampling frequency
As previously discussed, the sampling frequency refers to the speed at which the unit gathers data (32). The current body of research indicates that units with a higher sampling frequency (i.e. 10 and 15 Hz) provide greater reliability for measurement of distance. However, the sampling rate of a 15 Hz unit is in fact calculated by supplementing a 10 Hz GPS sampling rate with accelerometer data (43, 44). As a 15 Hz sampling rate GPS is actually indirectly produced using calculus, there is a great need for future research in order to verify the validity and reliability of this method.
In fact, a 2014 study demonstrated that a 10 Hz GPS unit had greater validity and inter-unit reliability than a 15 Hz GPS unit when measuring total distance (44) – perhaps suggesting that a 10 Hz unit is more accurate and reliable than a 15 Hz GPS. Regardless of the variations between 10 and 15Hz units, these have both been repeatedly proven to be more reliable at monitoring performance than 1 and 5 Hz models (44).
Movement Reliability
- Speed of Movement – Consistent amounts of research have shown that the slower the movement velocity of the athlete, the more accurate the GPS technology becomes and vice versa – the faster the athlete’s velocity, the less reliable the device. For example, one study demonstrated that the GPS was capable of accurately measuring an athlete’s movements at < 20 km/h, but struggled once speeds reached > 20 km/h (45). This would make sense given that the athlete is travelling larger distances but with the same sampling rate. This information suggests that caution should be taken with the reliability of the data if the athlete(s) was achieving velocities of > 20 km/h.
- Short-distance, high-speed movements – Most research on GPS technology has been conducted using linear running patterns consisting of moderate-long distances, with little research looking at intricate movements and random changes of direction typically seen in most sports (46). To our knowledge, only two articles have been published to date identifying the validity and reliability of intricate and sport-specific movements using GPS technology (46, 47). One study identified that 1 and 5 Hz GPS units significantly underestimated total distance, and speed of sport-based movements when compared to a high-resolution camera system (47). The second also suggests low inter-unit reliability and therefore advises practitioners to take caution when using GPS to monitor distance and speed – particularly when the distance is short, and speed is high (46). Despite this, it is currently understood that GPS systems provide acceptable levels of accuracy and reliability when measuring moderate-long distances whilst running at slow-moderate speeds, but this is largely reduced when measuring higher speeds over shorter distances (47, 48). Put simply, practitioners should take caution when analysing data derived from short-distance, high-speed movements (e.g. small-sided games).
Signal interferences
The United States Global Positioning System (GPS) is currently the Earth’s only fully functional Global Navigation Satellite System (GNSS) (49). At present, there are 24 GPS satellites currently orbiting Earth at approximately 11,000 nautical miles, each transmitting signals back and forth to GPS receivers – like those worn by the athletes. This transmission of information allows the satellites to determine (49):
- Location
- Speed
- Direction
- Distance
Different GPS models possess different technology, meaning some are able to connect to more satellites and obtain stronger connections than others. Units that can connect to more satellites and with stronger connections can typically provide more accurate data. The strength of these signals can often also be affected by dense foliage and urban surroundings such as heavy tree cover, tall buildings, and stadiums (49).
For example, using GPS systems inside stadiums and indoor sport complexes can potentially reduce the number of available satellites, and therefore affect the transfer of data. This interference, therefore, affects the transmission of signals between the satellites and the GPS units and thus results in ‘lost’ data. Though some researchers have developed software that identifies the cause of the signal loss, and provide calculations to manage it (50), to the best of our knowledge, we are unaware if:
- This calculation method is reliable in a sporting context.
- Whether any of the leading wearable technology manufacturers in sport use any of this software whatsoever.
Consequently, using GPS systems in urban areas, in sport complexes, or even in areas surrounded by dense foliage, can potentially reduce the reliability of the data, suggesting significant caution should be taken if this is attempted.
Location Precision
Without going into too much detail, satellite geometry can also affect the accuracy of GPS positioning. This effect is called Geometric Dilution of Precision (GDOP). Typical GPS receivers usually report the quality of satellite geometry by reporting the “Position Dilution of Precision”. In certain devices, you can typically check the quality of the satellite configuration your receiver (i.e. GPS unit) is currently using by looking at the PDOP value. A low Dilution of Precision indicates better accuracy and a high value indicates lower accuracy (34). However, to our knowledge, the commercially available GPS units used for monitoring athletic performance, do not allow coaches to determine this quality of precision – suggesting the need for this feature.

Tri-axial Accelerometer
As wearables are notorious for lacking reliability during short-distance, high-speed movements (e.g. accelerations) (51), the accelerometer data is often combined with the GPS data in an attempt to improve its reliability. Yet, to our knowledge, no research has proven the validity or reliability of such a method. In fact, one study reported that the 10 Hz unit was more reliable at predicting movement demands than the 15 Hz models (44). Interestingly, though the authors were aware of the issue when measuring short-distance, high-intensity movements, they did not measure accelerations or decelerations. As a result, perhaps combining accelerometer data with GPS data to improve the accuracy of short-distance, high-speed movements actually have an opposite effect – meaning the reliability is reduced, and maybe it is better to just use 10 Hz units.
A growing amount of research has attempted to use the tri-axial accelerometer to assess sport-specific activities (52-55). Both interestingly and importantly, one study identified that this micro-sensor is a reliable and useful tool for measuring low- and high-intensity locomotive movements in Australian Rules Football, and that this can be used to monitor loads over time (e.g. a season) (55). However, it was reported that this sensor, and variable (Player Load), fails to account for skill- and contact-based activities such as: jumping, kicking, tackling, passing, blocking and so on and therefore may underestimate actual workloads. Therefore, the “Player/Body Load” variable which appears to be derived purely from the accelerometer data (see formula below), and is often monitored by sports scientists, remains questionable as it may underestimate total workloads (33, 56).
Another area of concern regarding this variable is the unclear contribution of gyroscope data in the quantification of the Player/Body Load. Or in other words, if the gyroscope data is used with the accelerometer data to determine the Player/Body Load value. Despite sifting through the research, emailing experts in this field, and even contacting the lead manufacturers of this technology – receiving no response – it is unclear whether the gyroscope data has any contribution to this value.
Of interest, two studies have used the gyroscope in combination with the accelerometer to calculate collisions in rugby league and Australian rules football (57, 58). However, what is very interesting is that both of these studies only used the gyroscope to determine if the athlete was standing up (vertical), or in some degree of ‘lean’ (horizontal), and thus identify if they were performing a tackle or not. At no point have the authors reported that they used the sum of rotational forces from the gyroscope, in combination with the sum of perpendicular forces from the accelerometer, to calculate a “total” impact score in G-forces.
For a better example, imagine a rugby player tackling an opponent head-on at 10 G-forces (recorded by the accelerometer). In this form of tackle, the rotational forces may be minimal because there is not a great deal of rotation. However, imagine a player now tackling their opponent at 10 G-forces (recorded by the accelerometer) on an angle as they attempt to run past them. In this scenario, the total rotational acceleration forces may look much different (e.g. much bigger), and thus report much larger G-force summations. As no researchers have clearly stated how they have used the gyroscope data to assess the intensity of tackles, then this information must be interpreted with caution.
To summarise, the formula for calculating the “Player/Body Load” value appears only to be the sum of all accelerometer forces during that particular training session or tackle. The issue with this is that it does not appear to include any of the gyroscope data. Therefore, it may not include any of the rotational forces that would most definitely occur during a rugby tackle for example, and as a result only “paints half the picture”.
This error of not including gyroscope data appears continuous throughout the research conducted on attempting to measure physical workloads (53-55). If the researchers did incorporate the use of the gyroscope data, then this needs to be clearly explained during their methodology. Without this information, it appears that there is a significant flaw in the quantification of “impacts” or “Player/Body Load”. Therefore, the Player/Body Load variable and any others (e.g. dynamic stress load and step balance) must be interpreted with caution.
To add to the complexity of the issue, the algorithms used to quantify the Player/Body Load and the other variables must also be valid and reliable, but that is beyond the scope of this article.
Gyroscope, Magnetometer, and Heart Rate Monitor
To our knowledge, and after contacting several research specialists in the field of wearable technology, and contacting some of the major manufacturers of this technology (with no response), there appears to be no published evidence regarding the validity and/or reliability of these sensors. This, therefore, raises concerns with quantifying this data.
Troublingly, whilst no research has examined the validity or reliability of the gyroscope, it has been shown that combining both gyroscope and accelerometer data improves the accuracy of movement classification by 2-14 % (59, 60). This simply suggests that incorporating the use of the gyroscope data may improve the accuracy of the results. Furthermore, it has also been suggested that placing accelerometers and gyroscopes on each limb – as often done in biomechanical research – would also improve the accuracy of the results, rather than simply having one unit placed on the centre of the upper back (59). It is fully understood that this concept would cause practical issues during training or competition, but it simply highlights the issues and the need for technological development to enable such high-performance practices.
Are wearables better than iPhones?
In order to gain a better appreciation of what technology is in wearable units, we feel it is helpful to put this into the context of everyday life. Therefore, we will now discuss how these units compare against a common smartphone (iPhone). The iPhone contains four of the five micros-sensors that the wearable units possess. These are:
- GPS logger – enables you to use the Maps application and determine position.
- Magnetometer – enables you to identify the direction you are facing when using Maps.
- Accelerometer – allows the user to shake the phone to undo typing errors.
- Gyroscope – enables the user to change the screen view from portrait to landscape.
At present, there is very little information as to what specific microchips are included within the wearable units. Hypothetically, we do not know if the accelerometer is a Toshiba GV56X micro-chip (we made that up), and consequently, we do not know its reliability. As technology advances and the microchips change, the research also needs to stay up-to-date to ensure they are reliable.
Nonetheless, the table below (Table 1) compares the technical specification between common brand wearables and the iPhone. In fact, one recent study (63) has recently proposed a method using a single accelerometer contained within a smartphone worn on the upper back, with the aim of identifying seven different sporting activities (stationary, walking, jogging, sprinting, hitting a ball, standing tackle, dribbling a ball) (59). Thus an interesting research project, would be to compare the reliability of smartphone data in comparison to the wearable units typically used in sport.
Conclusion
- GPS appears moderately reliable for measuring player locomotion but struggles during high speeds, and during short and fast changes in direction.
- Sampling rate and satellite availability affect the reliability of data collection.
- The tri-axial accelerometer appears to be reliable for calculating low- and high-intensity locomotive movements, but only records three perpendicular planes of motion.
- There is little clarity regarding the inclusion of the gyroscope data to measure impacts and collisions, suggesting the use of the Player/Body Load variable, and others remains questionable.
- Including the gyroscope data improves movement classification by 2-14 %.
- The algorithms used to quantify Player/Body Load also play a significant role in the validity and reliability of the data, yet this is unknown.
- The validity and reliability of the gyroscope, magnetometer, and heart rate monitor are all unknown.
- The technology included within the wearables may be comparable to that within the common smartphone.
Recommended further reading
If you wish to understand this topic in greater detail, then we suggest the following articles for further reading:
- Cummins C, Orr R, O’Connor H, et al. Global positioning systems (GPS) and microtechnology sensors in team sports: a systematic review. Sports Med. 2013;43(10):1025–42
- Chambers R, Gabbett TJ, Cole MH, Beard A. The Use of Wearable Microsensors to Quantify Sport-Specific Movements – A Systematic Review. Sports Med (2015) 45:1065–1081
- Wundersitz DW, Josman C, Gupta R, Netto KJ, Gastin PB, Robertson S. Classification of team sport activities using a single wearable tracking device. J Biomech. 2015 Nov 26;48(15):3975-81
- Gabbett T. Quantifying the physical demands of collision sports: does microsensor technology measure what it claims to measure? J Strength Cond Res. 2013;27(8):2319–22.
- Boyd, L., Ball, K., Aughey, R.J., 2011. The reliability of MinimaxX accelerometers for measuring physical activity in Australian football. International Journal of Sports Physiology and Performance 6, 311-321.
- Schutz Y, Chambaz A. Could a satellite-based navigation system (GPS) be used to assess the physical activity of individuals on earth? Eur J Clin Nutr. 1997;51(5):338–9. [PubMed]
- Castagna C, Impellizzeri F, Cecchini E, et al. Effects of intermittent- endurance fitness on match performance in young male soccer players. J Strength Cond Res. 2009;23(7):1954–9. [PubMed]
- Barbero Alvarez J, Lopez M, Barbero Alvarez V, et al. Heart rate and activity profile for young female soccer players. J Hum Sport Exerc. 2008;3(2):1–11. [Link]
- Bucheit M, Mendez-Villanueva A, Simpson BM, et al. Match running performance and fitness in youth soccer. Int J Sports Med. 2010;31(11):818–25. [PubMed]
- Casamichana D, Castellano J. Heart rate and motion analysis by GPS in beach soccer. J Sports Sci Med. 2010;9:98–103. [PubMed]
- Hill-Haas SV, Coutts AJ, Rowsell GJ, et al. Variability of acute physiological responses and performance profiles of youth soccer players in small-sided games. J Sci Med Sport. 2008;11(5):487–90. [PubMed]
- Austin DJ, Kelly SJ. Positional differences in professional rugby league match play through the use of global positioning systems. J Strength Cond Res. 2013;27(1):14-9. [PubMed]
- Duffield R, Murphy A, Snape A, et al. Post match changes in neuromuscular function and the relationship to match demands in amateur Rugby League matches. J Sci Med Sport. 2012;15(3): 238–43. [PubMed]
- Gabbett TJ, Jenkins DG, Abernethy B. Physical demands of professional rugby league training and competition using microtechnology. J Sci Med Sport. 2012;15(1):80–6. [PubMed]
- McLellan CP, Lovell DI, Cass GC. Creatine kinase and endocrine responses of elite players pre, during and post rugby league match play. J Strength Cond Res. 2010;24(11):2908–19. [PubMed]
- Hartwig T, Naughton G, Searl J. Defining the volume and intensity of sport participation in adolescent Rugby Union players. Inter J Sports Physiol Perform. 2008;3:94–106. [PubMed]
- Hartwig T, Naughton G, Searl J. Motion analyses of adolescent Rugby Union players: a comparison of training and game demands. J Strength Cond Res. 2011;25(4):966–72. [PubMed]
- Suarez-Arrones JL, Portillo LJ, Gonzalez-Rave MJ, et al. Match running performance in Spanish elite male Rugby Union using global positioning system. Isokinetic Exer Sci. 2012;20:77–83. [Link]
- Venter R, Opperman E, Opperman S. The use of global positioning system (GPS) tracking devices to access movement demands and impacts in under-19 Rugby Union match play. Afr J Phys Health Ed Rec Dance. 2011;17(1):1–8. [Link]
- Higham DG, Pyne DB, Anson JM, et al. Movement patterns in Rugby sevens: effects of tournament level, fatigue and substitute players. J Sci Med Sport. 2012;15(3):277–82. [PubMed]
- Cunniffe B, Proctor W, Barker JS, et al. An evaluation of the physiological demands of elite Rugby Union using global positioning system tracking system. J Strength Cond Res. 2009; 23(4):1195–203. [PubMed]
- Aughey RJ. Increased high-intensity activity in elite Australian Football finals matches. Int J Sports Physiol Perform. 2011;6(3):367–79. [PubMed]
- Aughey RJ, Falloon C. Real-time versus post game GPS data in team sports. J Sci Med Sport. 2010;13(3):348–9. 19. [PubMed]
- Coutts AJ, Quinn J, Hocking J, et al. Match running performance in elite Australian Rules football. J Sci Med Sport. 2010;13(5):543–8. [PubMed]
- Mooney M, O’Brien B, Cormack S, et al. The relationship between physical capacity and match performance in elite Australian Football: a mediation approach. J Sci Med Sport. 2011;14(5):447–52. [PubMed]
- Piggot B, Newton M, McGuian M. The relationship between training load and incidence of injury and illness over a pre season at an Australian Football League club. J Aus Strength Cond. 2009;17(3):4–17. [Link]
- Wisbey B, Montgomery PG, Pyne DB, et al. Quantifying demands of AFL football using GPS tracking. J Sci Med Sport. 2010;13(5):531–6. [PubMed]
- Gabbett TJ. GPS analysis of elite women’s field hockey training and competition. J Strength Cond Res. 2010;24(5):1321–4. [PubMed]
- Jennings DH, Cormack SJ, Coutts AJ, et al. International field hockey players perform more high speed running than national level counterparts. J Strength Cond Res. 2012;26(4):947–52. [PubMed]
- Macutkiewicz D, Sunderland C. The use of GPS to evaluate activity profiles of elite women hockey players during matchplay. J Sports Sci. 2011;29(9):967–73. [PubMed]
- Higgins T, Naughton GA, Burgess D. Effects of wearing compression garments on physiological and performance measures in a simulated game-specific circuit for netball. J Sci Med Sport. 2009;12(1):223–6. [PubMed]
- Duffield R, Steinbacher G, Fairchild TJ. The use of mixed method, part body pre-cooling procedures for team-sport athletes in the heat. J Strength Cond Res. 2009;23(9):2524–32. [PubMed]
- Ahmadi A, Rowlands D, James D. Towards a wearable device for skill assessment and skill acquisition of a tennis player during the first serve. Sports Tech. 2009;2(3–4):129–36. [Link]
- Bonomi A, Goris A, Yin B, et al. Detection of type, duration, and intensity of physical activity using an accelerometer. Med Sci Sports Exerc. 2009;41(9):1770–7. [PubMed]
- Chardonnens J, Favre J, Le Callennec B, et al. Automatic measurement of key ski jumping phases and temporal events with a wearable system. J Sport Sci. 2012;30(1):53–61. [PubMed]
- Chardonnens J, Favre J, Cuendet F, et al. Characterization of lower-limbs inter-segment coordination during the take-off extension in ski jumping. Hum Mov Sci. 2013;32(4):741–52. [Link]
- Cummins C, Orr R, O’Connor H, et al. Global positioning systems (GPS) and microtechnology sensors in team sports: a systematic review. Sports Med. 2013;43(10):1025–42 [PubMed]
- Chambers R, Gabbett TJ, Cole MH, Beard A. The Use of Wearable Microsensors to Quantify Sport-Specific Movements – A Systematic Review. Sports Med (2015) 45:1065–1081 [PubMed]
- Understanding the Global Positioning System. 2016. Understanding the Global Positioning System. [ONLINE] [Accessed 08 March 2016].
- TEAM PERFORMANCE MONITORING – Catapult Innovations Pty Ltd. 2016. TEAM PERFORMANCE MONITORING – Catapult Innovations Pty Ltd. [ONLINE] Available at: [Link] [Accessed 08 March 2016].
- Boyd L, Ball K, Aughey R. The reliability of MinimaxX accelerometers for measuring physical activity in Australian football. Int J Sports Physiol Perform. 2011;6:311–21. [PubMed]
- McLellan, CP, Lovell, DI, and Gass, GC. Biochemical and endocrine responses to impact and collision during elite rugby league match play. J Strength Cond Res 25(6): 1553–1562, 2011 [PubMed]
- Jean-Louis G, Von Gizycki H, Zizi F, et al. Determination of sleep and wakefulness with the actigraph data analysis software (ADAS). Sleep. 1996;19(9):739–43. [PubMed]
- Bonomi A, Goris A, Yin B, et al. Detection of type, duration, and intensity of physical activity using an accelerometer. Med Sci Sports Exerc. 2009;41(9):1770–7. [PubMed]
- Sleep Cycle alarm clock on the App Store. 2016. Sleep Cycle alarm clock on the App Store. [ONLINE] Available at: [Link] [Accessed 18 March 2016].
- Waldron MT, Highton C, Worsolf J, et al. Movement and physiological match demands of elite Rugby League using portable global positioning systems. J Sports Sci. 2011;29(11):1223–30. [PubMed]
- Gabbett T. Quantifying the physical demands of collision sports: does microsensor technology measure what it claims to measure? J Strength Cond Res. 2013;27(8):2319–22. [PubMed]
- Aughey, RJ. Applications of GPS technologies to field sports. Int J Sports Physiol Perform 6: 295–310, 2011 [PubMed]
- Johnston, RJ, Watsford, ML, Kelly, SJ, Pine, MJ, and Spurrs, RW. Validity and interunit reliability of 10 Hz and 15 Hz GPS units for assessing athlete movement demands. J Strength Cond Res 28(6): 1649–1655, 2014 [PubMed]
- Johnston R, Watsford M, Pine M, et al. The validity and reliability of 5-Hz global positioning system units to measure team sport movement demands. J Strength Cond Res. 2012;26(3): 758–65. [PubMed]
- Vickery, WM, Dascombe, BJ, Baker, JD, Higham, DG, Spratford, WA, and Duffield, R. Accuracy and reliability of GPS devices for measurement of sports-specific movement patterns related to cricket, tennis, and field-based team sports. J Strength Cond Res 28(6): 1697–1705, 2014 [PubMed]
- Duffield, R, Reid, M, Baker, J, and Spratford, W. Accuracy and reliability of GPS devices for measurement of movement patterns in confined spaces for court-based sports. J Sci Med Sport 13, 2010. [PubMed]
- Coutts, AJ and Duffield, R. Validity and reliability of GPS devices for measuring movement demands of team sports. J Sci Med Sport 13: 133–135, 2010. [PubMed]
- Maddison R, Ni Mhurchu C. Global positioning system: a new opportunity in physical activity measurement.The International Journal of Behavioral Nutrition and Physical Activity. 2009;6:73. [PubMed]
- Chung E, Shalaby A: A trip reconstruction tool for GPS-based personal travel surveys. Transportation Planning and Technology 2005, 28(5):381-401. [Link]
- Buchheit M, Al Haddad H, Simpson BM, Palazzi D, Bourdon PC, Di Salvo V, Mendez-Villanueva A. Monitoring accelerations with GPS in football: time to slow down? Int J Sports Physiol Perform. 2014 May;9(3):442-5. [PubMed]
- Colby, MJ, Dawson, B, Heasman, J, Rogalski, B, and Gabbett, TJ. Accelerometer and GPS-derived running loads and injury risk in elite Australian footballers. J Strength Cond Res 28(8): 2244– 2252, 2014 [PubMed]
- Boyd LJ, Ball K, Aughey RJ. Quantifying external load in Australian football matches and training using accelerometers. Int J Sports Physiol Perform. 2013 Jan;8(1):44-51. [PubMed]
- Cormack S, Smith R, Mooney M, et al. Accelerometer load as a measure of activity profile in different standards of netball match play. Int J Sports Physiol Perform. 2014;9:283–91. [PubMed]
- Boyd, L., Ball, K., Aughey, R.J., 2011. The reliability of MinimaxX accelerometers for measuring physical activity in Australian football. International Journal of Sports Physiology and Performance 6, 311-321. [PubMed]
- Cunniffe B, Proctor W, Baker J, et al. An evaluation of the physiological demands of elite rugby union using global positioning system tracking software. J Strength Cond Res. 2009;23(4):1195–203. [PubMed]
- Gabbett T, Jenkins D, Abernethy B. Physical collisions and injury during professional rugby league skills training. J Sci Med Sport. 2010;13(6):578–83. [PubMed]
- Gastin P, Breed R, McLean O, et al. Quantification of tackling demands in elite Australian football using integrated wearable athlete technology. J Sci Med Sport. 2013;16(6):281. [PubMed]
- Wundersitz DW, Josman C, Gupta R, Netto KJ, Gastin PB, Robertson S. Classification of team sport activities using a single wearable tracking device. J Biomech. 2015 Nov 26;48(15):3975-81 [PubMed]
- Bulling, A., Blanke, U., Schiele, B., 2014. A tutorial on human activity recognition using body-worn inertial sensors. ACM Computing Surveys 46, 1-33. [Link]
- ios – Changes in accelerometer / gyroscope limitations for iPhone 5 / 5th Gen iPod Touch? – Stack Overflow. 2016. ios – Changes in accelerometer / gyroscope limitations for iPhone 5 / 5th Gen iPod Touch? – Stack Overflow. [ONLINE] Available at: [Link] [Accessed 09 March 2016].
- TrackAddict Documentation – Accuracy. 2016. TrackAddict Documentation – Accuracy. [ONLINE] Available at: [Link] [Accessed 09 March 2016].
- Mitchell, E., Monaghan, D., Connor, N., 2013. Classification of Sporting Activities Using Smartphone Accelerometers. Sensors 13, 5317-5337. [PubMed]
