
Contents of Article
- Summary
- What is the Rate of Force Development (RFD)?
- What impacts the Rate of Force Development?
- Why is the Rate of Force Development important for sports?
- How do you calculate the Rate of Force Development?
- Is the Rate of Force Development valid and reliable?
- How do you improve your Rate of Force Development?
- Conclusion
- References
- About the Author
Summary
The Rate of Force Development (RFD) is a measure of explosive strength, or simply how fast an athlete can develop force. Athletes with a higher RFD have been shown to perform better during numerous physical performance tests. This, therefore, highlights the potential importance this value has in the role of athletic development.
Whilst many forms of training have been shown to improve the RFD in untrained individuals, only resistance and ballistic training have been shown to enhance this quality in trained athletes. Lastly, though there are multiple ways to measure the RFD, the time-interval sampling windows appear to be the most reliable.

What is the Rate of Force Development?
The RFD is a measure of explosive strength, or simply how fast an athlete can develop force – hence the ‘rate’ of ‘force development’. This is defined as the speed at which the contractile elements of the muscle can develop force (1). Therefore, improving an athlete’s RFD may make them more explosive as they can develop larger forces in a shorter period of time. Developing a more explosive athlete may improve their sporting performance. In fact, higher RFDs have been directly linked with better jump (2-8), sprint (9), cycling (10), weightlifting (5, 6), and even golf swing performances (11).
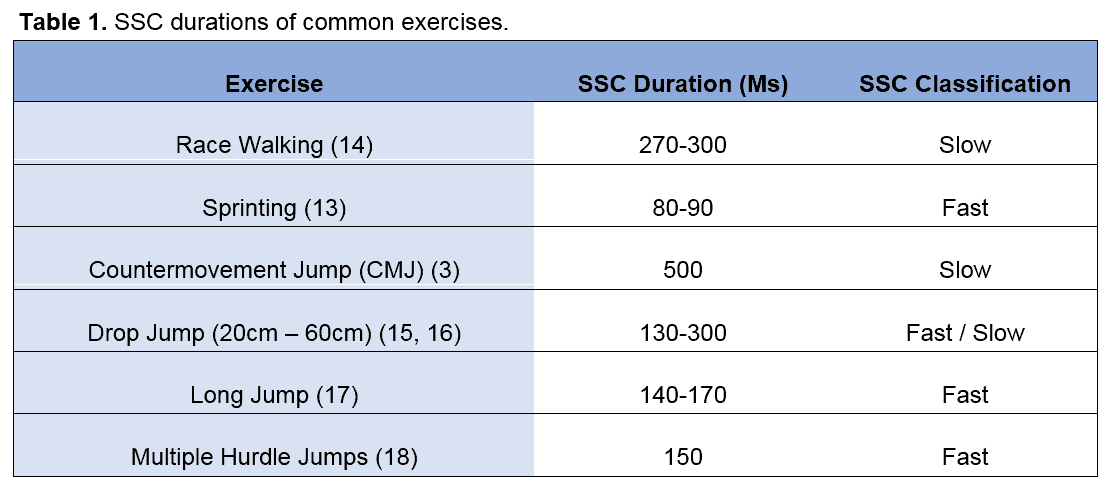
The RFD is commonly believed to be manifested during the stretch-shortening cycle (SSC). Depending upon the duration of SSC, exercises are classified as either slow- (≥ 250 milliseconds) or fast-SSC (≤ 250 milliseconds) movements (12). For example, a counter-movement jump (CMJ) is classified as a slow-SSC movement as the duration of the SSC lasts approximately 500 milliseconds (3). On the other hand, sprinting is classified as a fast-SSC movement as the duration of the SSC lasts between 80-90 milliseconds (13). Table 1 displays the SSC durations of some common exercises.
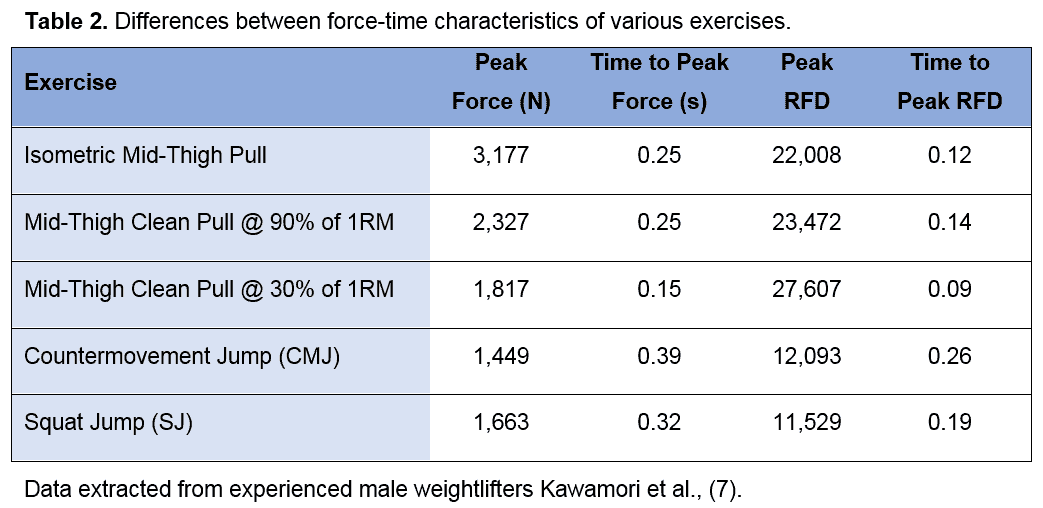
Because the movement is slower, exercises with slow-SSC have a longer timeframe to develop force than those with a fast-SSC; this means slow-SSC exercises can typically create higher peak forces (7, 19). However, as there is typically less urgency to develop force during the slow-SSC movements, they often do not develop force as quickly as fast-SSC movements. This means that exercises with a slow-SSC produce lower RFDs than fast-SSC movements (7, 19). Therefore, slow-SSC exercises produce higher peak forces, but lower RFD than fast-SSC movements.
On the other hand, as it takes 140-710 milliseconds to develop peak force during various jump exercises (7, 5, 20), fast-SSC exercises may struggle to produce peak forces because the SSC simply does not last long enough. Whilst they may not be capable of producing peak forces, they can produce large a RFD due to the speed of the movement (Table 2).
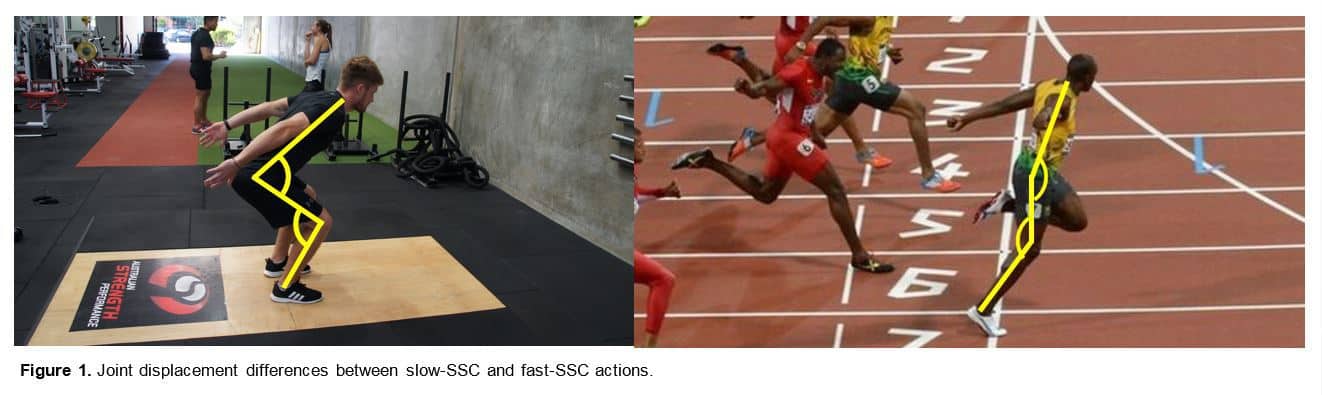
It is suggested that exercises characterised by larger joint displacements (i.e. work through a larger range of movement) are typically categorised as slow-SSC movements. Whereas exercises with smaller joint displacements are commonly referred to as fast-SSC movements (21). For example, a CMJ (slow-SSC movement) experiences larger joint displacements than sprinting (fast-SSC) (Figure 1). This helps to dissociate between what are slow-SSC movements and what are fast-SSC movements when no research has determined what classification they belong to.
What impacts the Rate of Force Development?
Improvements in RFD are likely to be the result of increases in muscle-tendon stiffness (22, 23), enhanced muscle force production via changes in muscle fibre type or type area (from type I to type IIA) (24, 25), and increases in neural drive during the early phase of the SSC (< 100 ms) (26, 27). In contrast, RFD appears to be negatively affected by changes in muscle fibre type (from type IIX to type IIA) (28), and increases in fascicle length (causing reduced muscle stiffness) (29).
Why is the Rate of Force Development important for sports?
As power is a key determinant in the performances of many sports, optimising an athlete’s explosiveness may be of great importance (30-35). Research has identified that RFD has been directly linked to performances during jumping (2-8), weightlifting (5, 6), cycling (10), sprinting (9), and even during the golf swing (11) – suggesting a better RFD can lead to better athletic performance. Moreover, elite sprinters have been shown to possess greater RFD than well-trained sprinters (9). Collectively, this information suggests that RFD may be an important contributor to athletic performance.
- RFD linked to better jump, sprint, cycling, weightlifting, and golf swing performances
- Elite-level sprinters have better RFD than well-trained sprinters
- Power-trained athletes have greater RFD than non-power-trained athletes (36).
- Power-trained athletes have greater RFD than endurance athletes (36).
How do you calculate the Rate of Force Development?
As RFD is an expression of explosive strength, it is measured in Newtons per second squared (N·s-1). The RFD can be calculated for isometric, concentric and eccentric muscle contractions, with the latter two otherwise referred to in the research as the ‘positive’ and ‘negative’ acceleration phases of the SSC (2, 3). In fact, one study suggests that eccentric RFD is a better predictor of jump performance than concentric RFD because it summarises several intrinsic properties of muscle and tendons during a key moment (2). However, this is yet to be validated by other research.
Multiple measures of RFD have been developed in order to measure various components of performance during both isometric and dynamic movements:
- Average RFD or IES (Index of Explosiveness) (2, 3, 5, 6, 8, 9, 11, 37, 38)
- Time-interval RFD (11, 39)
- Instantaneous RFD (40, 41)
- Peak or maximal RFD (42, 4, 5, 7, 10, 11, 36)
- Time to peak RFD (11, 7)
Average RFD
This value is identical to the IES discussed by Zatsiorsky (1995) (37) and is calculated by dividing the peak force by the time to achieve peak force (39). However, this form of measuring average RFD has been shown to have lower levels of reliability in comparison to time-interval RFD and peak RFD (39). These lower levels of reliability may be associated with each athlete’s time to achieve peak force, as not all athletes can achieve peak force in the same time frame. Therefore, measuring RFD using predetermined time intervals can accommodate for these variances.
How to calculate Average RFD
Example – Calculating Average RFD
Average RFD [N·s-1] = Peak Force [N] / Time to achieve peak force [s][/toggle]
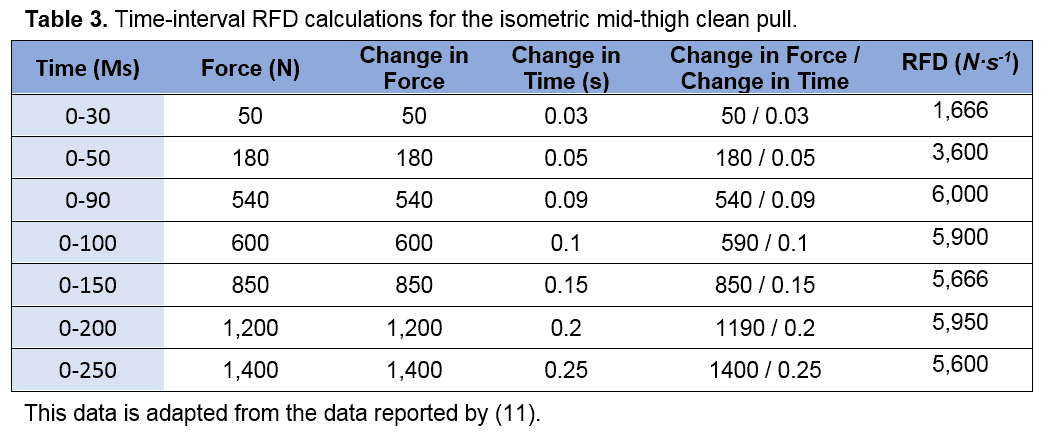
Time-Interval RFD: Though this measure of RFD is effectively the same as average RFD, it is calculated at various time intervals (e.g. 0-30, 0-50, 0-90, 0-100, 0-150, 0-200, and 0-250 milliseconds [39]). This value simply represents a change in force divided by a change in time. It is calculated by dividing the force at the end of the time interval by the duration of the time interval (39) (Table 3). Just note that when calculating RFD, the time should be calculated in seconds, not milliseconds.
How to Calculate Time-Interval RFD
Example – Calculating RFD with a 0-30 millisecond time-interval:
RFD [N·s-1] = Change in Force [N] / Change in Time [s]
RFD [N·s-1] = Force [N] at 30 milliseconds / 0.03 second time-interval [s]
RFD [N·s-1] = 50N / 0.03s
RFD [N·s-1] = 1,666
The strength and conditioning coach should select the time intervals they wish to use based upon the nature of the exercise. For example, if the exercise has a fast-SSC movement (e.g. Sprinting – 80-90 milliseconds), then it may be suggested that time intervals of ≤ 100 milliseconds may be most appropriate (e.g. 0-50, 0-90, and 0-100 milliseconds). Furthermore, the early time intervals (< 100 ms) are often referred to as ‘early phase’ RFD, whilst > 100s time intervals are referred to as ‘late phase’ RFD.
Instantaneous RFD
This value is measured by using the maximal tangential slope between two adjacent data points. In other words, the data is recorded using 1 millisecond time intervals, and from this, the change in force is divided by the change in time at every 1 millisecond time interval. As this value of RFD is calculated every 1 millisecond, it provides a very precise measure of RFD.
Peak or Maximal RFD
This value of RFD is really as simple as it sounds, it is the largest amount of RFD produced during the movement. Most commonly, the value is identified by measuring the peak RFD during numerous sampling windows of 1, 2, 5, 10, 20, 30, and 50 (40, 39). For example, if the strength and conditioning coach selected a sampling window of 5 milliseconds, they would measure peak RFD every 5 milliseconds (e.g. 0-5, 5-10, and 10-15 milliseconds and so forth). They would then simply identify the largest RFD value out of those recorded – this value is then the peak RFD. Whilst all of these sampling windows have been reported as reliable measures of peak RFD, the 20 millisecond sampling window has been shown to be the most reliable (39). Table 4 demonstrates how to identify peak RFD during an isometric performance.
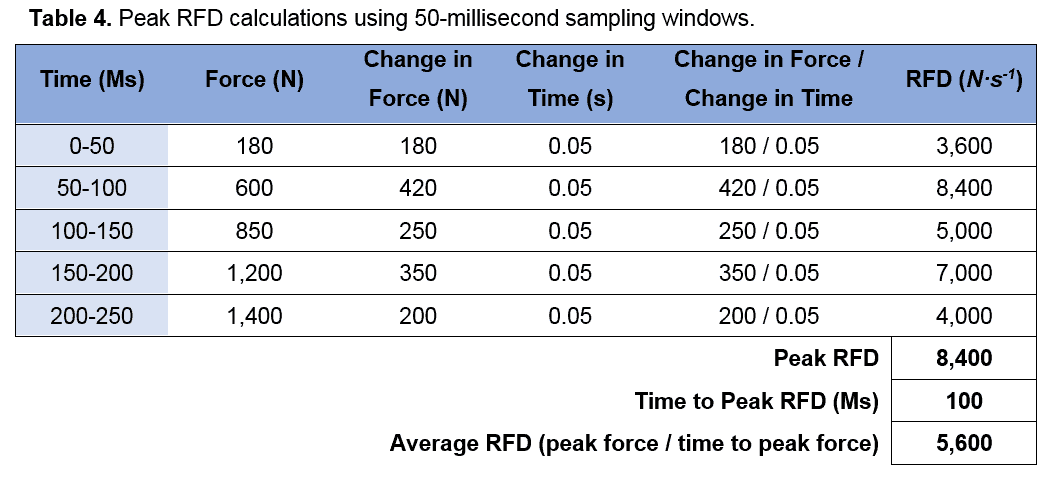
From this data, the coach is able to calculate the athlete’s peak RFD, time to peak RFD and average RFD. These variables are useful tools for comparing a group of athletes to identify who the best and worst individuals are at developing force quickly.
Time to Peak RFD
As displayed in Table 4, this value of RFD is extremely straightforward. It is a useful tool for measuring performance as it provides the coach with information on how quickly the athlete is able to achieve their maximal explosive strength (i.e. peak RFD). Decreasing an athlete’s time to achieve peak RFD will allow them to produce higher forces in shorter periods of time, and therefore may increase their explosiveness and overall athletic performance.
Is the Rate of Force Development valid and reliable?
The RFD and its various measures (Average RFD, Time-Interval RFD, Peak RFD, and Time to Peak RFD) have all been shown to be valid and reliable tools for assessing explosive strength (11, 39). However, the most reliable measures for assessing RFD appears to be any of the time-interval sampling windows (i.e. 0-30, 0-50, 0-90, 0-100, 0-150, 0-200, and 0-250 milliseconds), and peak RFD using 20 millisecond windows (39). It is therefore recommended that these two variables should be preferable when measuring RFD.
How do you improve your Rate of Force Development?
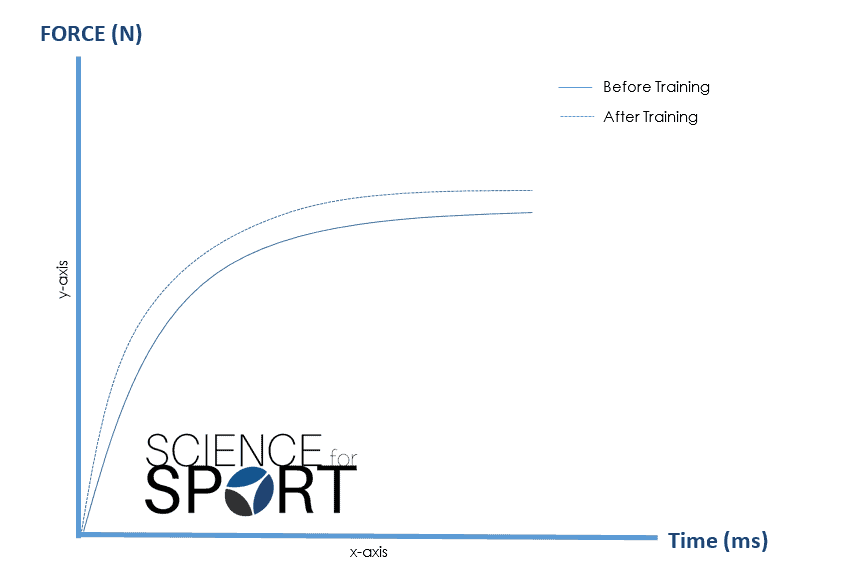
Increasing the RFD whilst simultaneously reducing the time in which peak RFD occurs, will result in a left and upward shift in the force-time curve (Figure 2). This left and upward shift enables the athlete to produce greater forces in a shorter period of time, ultimately improving their explosiveness.
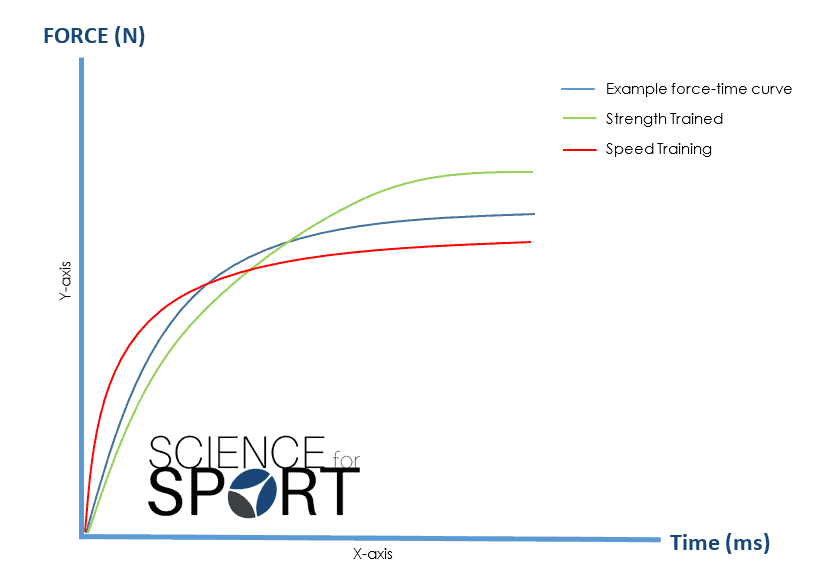
It is often suggested that athletes must train at various sections along the force-time curve if improvements in RFD are to occur. By only training on one part of the force-time curve (e.g. maximum strength), it is likely the athlete will only improve their performance at that section on the paradigm. For example, only training maximal strength may lead to improvements in force production, but it may also result in a reduction in the time to achieve that force (Figure 3).
As training programmes that combine strength and power training have been repeatedly shown to improve athletic performance more than strength or speed training alone (43), there is no surprise that most exercise professionals commonly use an all-rounded approach within their programming.
The following types of training have all shown to improve RFD:
- Resistance training (44, 45, 46, 47, 48)
- Ballistic training (49, 50, 51, 52)
- Olympic Weightlifting (53)
- Plyometric training (54, 55, 50, 56)
- Balance training (57, 58)
However, only those listed below have shown RFD improvements in trained or athletic subjects:
- Resistance training (59, 60, 61, 62, 63)
- Ballistic training (51, 52)
So whilst numerous training methods have been shown to improve RFD in untrained and elderly males and females, little research has shown RFD improvements in trained or athletic subjects.
Conclusion
RFD is a reliable measure of explosive strength, with higher RFDs have been linked with better athletic performance. Improvements in RFD are likely to be the result of increases in muscle-tendon stiffness, enhanced muscle force production via changes in muscle fibre type (from type I to type IIA), and increases in neural drive.
The most reliable values for measuring this component of performance appear to be calculating RFD at various time intervals and peak RFD using 20-millisecond sampling windows. Though various methods of training have been shown to improve performance (resistance, ballistic, Olympic Weightlifting, plyometrics, and balance training), only resistance and ballistic training have been proven to increase RFD in trained and athletic populations.
- Aagaard P., Simonsen E.B., Andersen J.L., Magnusson P., and Dyhre-Poulsen P. (2002) Increased rate of force development and neural drive of human skeleton muscle following resistance training. J Appl Physiol 93: 1318-1326. [PubMed]
- Laffaye, G., & Wagner, P. (2013). Eccentric rate of force development determines jumping performance. Computer Methods in Biomechanics and Biomedical Engineering, 16(1), pp.82–83. [Link]
- Laffaye, G, Wagner, PP, and Tombleson, TIL. Countermovement jump height: Gender and sport-specific differences in the forcetime variables. J Strength Cond Res 28(4): 1096–1105, 2014 [PubMed]
- Haff, GG, Carlock, JM, Hartman, MJ, Kilgore, JL, Kawamori, N, Jackson, JR, Morris, RT, Sands, WA, and Stone, MH. Force-time curve characteristics of dynamic and isometric muscle actions of elite women Olympic weightlifters. J Strength Cond Res 19: 741–748, 2005. [PubMed]
- McLellan, CP, Lovell, DI, and Gass, GC. The role of rate of force development on vertical jump performance. J Strength Cond Res 25(2): 379–385, 2011 [PubMed]
- Haff, GG, Stone, MH, O’Bryant, HS, Harman, E, Dinan, CN, Johnson, R, and Han, KH. Force-time dependent characteristics of dynamic and isometric muscle actions. J Strength Cond Res 11: 269– 272, 1997. [Link]
- Kawamori, N, Rossi, SJ, Justice, BD, Haff, EE, Pistilli, EE, O’Bryant, HS, Stone, MH, and Haff, GG. Peak force and rate of force development during isometric and dynamic mid-thigh clean pulls performed at various intensities. J Strength Cond Res 20: 483–491, 2006. [PubMed]
- Nuzzo, JL, McBride, JM, Cormie, P, and McCaulley, GO. Relationship between countermovement jump performance and multijoint isometric and dynamic tests of strength. J Strength Cond Res 22: 699–707, 2008. [PubMed]
- Slawinski, J, Bonnefoy, A, Leveˆque, JM, Ontanon, G, Riquet, A, Dumas, R, and Che` ze, L. Kinematic and kinetic comparisons of elite and well-trained sprinters during sprint start. J Strength Cond Res 24(4): 896–905, 2010 [PubMed]
- Stone, MH, Sands, WA, Carlock, J, Callan, S, Dickie, D, Daigle, K, Cotton, J, Smith, SL, and Hartman, M. The importance of isometric maximum strength and peak rate-of-force development in sprint cycling. J Strength Cond Res 18(4): 878–884, 2004. [PubMed]
- Leary, BK, Statler, J, Hopkins, B, Fitzwater, R, Kesling, T, Lyon, J, Phillips, B, Bryner, RW, Cormie, P, and Haff, GG. The relationship between isometric force-time curve characteristics and club head speed in recreational golfers. J Strength Cond Res 26: 2685–2697, 2012. [PubMed]
- Turner, A., and Jeffreys, I. (2010). The Stretch-Shortening Cycle: Proposed Mechanisms and Methods for Enhancement. Strength and Conditioning Journal. 32(4), pp.87-99. [PubMed]
- Taylor, M. J. D., & Beneke, R. (2012). Spring Mass Characteristics of the Fastest Men on Earth.International journal of sports medicine, 33(8), 667.[PubMed]
- Padulo, J, Annino, G, D’Ottavio, S, Vernillo, G, Smith, L, Migliaccio, GM, and Tihanyi, J. Footstep analysis at different slopes and speeds in elite race walking. J Strength Cond Res 27(1): 125–129, 2013 [PubMed]
- Ball, NB, Stock, CG, and Scurr, JC. Bilateral contact ground reaction forces and contact times during plyometric drop jumping. J Strength Cond Res 24(10): 2762–2769, 2010. [PubMed]
- Walsh, M, Arampatzis, A, Schade, F, and Bruggemann, G. The effect of drop jump starting height and contact time on power, work performed and moment of force. J Strength Cond Res 18: 561–566, 2004. [PubMed]
- Stefanyshyn, D. & Nigg, B. (1998) Contribution of the lower extremity joints to mechanical energy in running vertical jumps and running long jumps. Journal of Sport Sciences, 16, 177-186.[PubMed]
- Flanagan EP and Comyns TM. The use of contact time and the reactive strength index to optimise fast stretch-shortening cycle training. Strength Cond J 30: 33– 38, 2008. [Link]
- Jensen, R.L., Flanagan, E.P., & Ebben, W.P. (2008). Rate of force development and time to peak force during plyometric exercises. Musculoskeletal Mechanics, ISBS Conference 2008, July 14-18, 2008, Seoul, Korea. 199-202. [Link]
- Markstrom, JL and Olsson, CJ. Countermovement jump peak force relative to body weight and jump height as predictors for sprint running performances: (In)homogeneity of track and field athletes? J Strength Cond Res 27(4): 944–953, 2013 [PubMed]
- Ebben WP, Flanagan EP, Jensen RJ. Gender Similarities in Rate of Force Development and Time to Takeoff during the Countermovement Jump. Journal of Exercise Physiology, 2007;10(6):10-17. [Link]
- Kubo, K., Kanehisa, H., Ito, M., & Fukunaga, T. (2001). Effects of isometric training on the elasticity of human tendon structures in vivo. Journal of Applied Physiology, 91(1), 26-32.[PubMed]
- Burgess, K. E., Connick, M. J., Graham-Smith, P., & Pearson, S. J. (2007). Plyometric vs. isometric training influences on tendon properties and muscle output. The Journal of Strength & Conditioning Research, 21(3), 986-989.[PubMed]
- Häkkinen, K., Alen, M., Kraemer, W. J., Gorostiaga, E., Izquierdo, M., Rusko, H., & Paavolainen, L. (2003). Neuromuscular adaptations during concurrent strength and endurance training versus strength training. European journal of applied physiology, 89(1), 42-52.[PubMed]
- Aagaard, P., Simonsen, E. B., Andersen, J. L., Magnusson, P., & Dyhre-Poulsen, P. (2002a). Increased rate of force development and neural drive of human skeletal muscle following resistance training. Journal of applied physiology, 93(4), 1318-1326.[PubMed]
- Van Cutsem, M., Duchateau, J., & Hainaut, K. (1998). Changes in single motor unit behaviour contribute to the increase in contraction speed after dynamic training in humans. The Journal of Physiology, 513(Pt 1), 295.[PubMed]
- Vila-Chã, C., Falla, D., Correia, M. V., & Farina, D. (2012). Changes in H reflex and V wave following short-term endurance and strength training. Journal of Applied Physiology, 112(1), 54-63.[PubMed]
- Andersen, L. L., Andersen, J. L., Zebis, M. K., & Aagaard, P. (2010). Early and late rate of force development: differential adaptive responses to resistance training?. Scandinavian journal of medicine & science in sports, 20(1), e162-e169.[PubMed]
- Blazevich, A. J., Cannavan, D., Horne, S., Coleman, D. R., & Aagaard, P. (2009). Changes in muscle force-length properties affect the early rise of force in vivo. Muscle & nerve, 39(4), 512.[PubMed]
- Baker, D and Nance, S. (1999). The relation between strength and power in professional rugby league players. Journal of Strength and Conditioning Research, 13: 224–229. [Link]
- Comfort, P, Allen, M, and Graham-Smith, P. (2011a). Kinetic comparisons during variations of the power clean. Journal of Strength and Conditioning Research, 25: 3269– 3273. [PubMed]
- Comfort, P, Fletcher, C, and McMahon, JJ. (2012). Determination of optimal load during the power clean in collegiate athletes. Journal of Strength and Conditioning Research, 26: 2970–2974. [PubMed]
- Cormie, P, McBride, JM, and McCaulley, GO. (2007). Validation of power measurement techniques in dynamic lower body resistance exercises. J Appl Biomech 23: 103–118. [PubMed]
- Cronin, J, McNair, PJ, and Marshall, RN. (2001). Developing explosive power: A comparison of technique and training. J Sci Med Sport 4: 59–70. [PubMed]
- Garhammer, J. & Gregor, R. (1992). Propulsion Forces as a Function of Intensity for Weightlifting and Vertical Jumping, J. Appl. Sports Sci. Research, 6(3): 129-134. [Link]
- Hakkinen, K., and E. Myllyla. Acute effects of muscle fatigue and recovery on force production and relaxation in endurance, power and strength athletes. Sports Med. Phys. Fitness 30: 5–12. 1990. [PubMed]
- Zatsiorsky, VM. Science and Practice of Strength Training. Champaign, IL: Human Kinetics, 1995. [Link]
- Comfort, P., Udall, R., & Jones, P.A. (2012). The effect of loading on kinematic and kinetic variables during the mid-thigh clean pull. Journal of Strength and Conditioning Research. 26(5):1208-14, [PubMed]
- Haff, GG, Ruben, RP, Lider, J, Twine, C, and Cormie, P. A comparison of methods for determining the rate of force development during isometric midthigh clean pulls. J Strength Cond Res 29(2): 386–395, 2015 [PubMed]
- Comfort, P, Allen, M, and Graham-Smith, P. Comparisons of peak ground reaction force and rate of force development during variations of the power clean. J Strength Cond Res 25(5): 1235–1239, 2011a [PubMed]
- Comfort, P, Allen, M, and Graham-Smith, P. Kinetic comparisons during variations of the power clean. J Strength Cond Res 25(12): 3269–3273, 2011b [PubMed]
- Wilson, G.J., Lyttle, A.D., Ostrowski, K.J., & Murphy, A.J. (1995). Assessing dynamic performance: A comparison of rate of force development tests. J Strength Cond Res, 9(3), 176-181. [Link]
- Stone, M.H., (1993). Literature review: Explosive exercises and training. National Strength and Conditioning Association Journal, 15(3), pp.7-15. [Link]
- Thompson, B. J., Stock, M. S., Shields, J. E., Luera, M. J., Munayer, I. K., Mota, J. A., & Olinghouse, K. D. (2015). Barbell deadlift training increases the rate of torque development and vertical jump performance in novices. The Journal of Strength & Conditioning Research, 29(1), 1-10.[PubMed]
- Unhjem, R., Lundestad, R., Fimland, M. S., Mosti, M. P., Wang, E. (2015) Strength training-induced responses in older adults: attenuation of descending neural drive with age. Age. [PubMed]
- Mosti, M. P., Carlsen, T., Aas, E., Hoff, J., Stunes, A. K., & Syversen, U. (2014). Maximal Strength Training Improves Bone Mineral Density and Neuromuscular Performance in Young Adult Women. The Journal of Strength & Conditioning Research, 28(10), 2935-2945.[PubMed]
- Oliveira, F. B., Oliveira, A. S., Rizatto, G. F., & Denadai, B. S. (2013a). Resistance training for explosive and maximal strength: effects on early and late rate of force development. Journal of sports science & medicine, 12(3), 402.[PubMed]
- Branislav, R., Milivoj, D., Abella, C. P., Deval, V. C., & Siniša, K. (2013). Effects of combined and classic training on different isometric rate of force development parameters of leg extensors in female volleyball players: Discriminative analysis approach. Journal of research in medical sciences: the official journal of Isfahan University of Medical Sciences, 18(10), 840.[PubMed]
- Kramer, A., Ritzmann, R., Gruber, M., & Gollhofer, A. (2012). Four weeks of training in a sledge jump system improved the jump pattern to almost natural reactive jumps. European journal of applied physiology, 112(1), 285.[PubMed]
- De Villarreal, E. S. S., Izquierdo, M., & Gonzalez-Badillo, J. J. (2011). Enhancing jump performance after combined vs. maximal power, heavy-resistance, and plyometric training alone. The Journal of Strength & Conditioning Research, 25(12), 3274-3281.[PubMed]
- Newton, R. U., Kraemer, W. J., & Häkkinen, K. (1999). Effects of ballistic training on preseason preparation of elite volleyball players. Medicine and science in sports and exercise, 31(2), 323.[PubMed]
- Cormie, P., McGuigan, M. R., & Newton, R. U. (2010). Influence of strength on magnitude and mechanisms of adaptation to power training. Medicine and science in sports and exercise, 42(8), 1566.[PubMed]
- Haff, G. G., Jackson, J. R., Kawamori, N., Carlock, J. M., Hartman, M. J., Kilgore, J. L., & Stone, M. H. (2008). Force-time curve characteristics and hormonal alterations during an eleven-week training period in elite women weightlifters. Journal of strength and conditioning research, 22(2), 433-446.[PubMed]
- Behrens, M., Mau-Moeller, A., & Bruhn, S. (2014). Effect of plyometric training on neural and mechanical properties of the knee extensor muscles. International journal of sports medicine, 35(2), 101.[PubMed]
- Correa, C. S., LaRoche, D. P., Cadore, E. L., Reischak-Oliveira, A., Bottaro, M., Kruel, L. F. M., & Pinto, R. S. (2012). 3 Different types of strength training in older women. International journal of sports medicine, 33(12), 962.[PubMed]
- Kyröläinen, H., Avela, J., McBride, J. M., Koskinen, S., Andersen, J. L., Sipilä, S., & Komi, P. V. (2005). Effects of power training on muscle structure and neuromuscular performance. Scandinavian journal of medicine & science in sports, 15(1), 58.[PubMed]
- Gruber, M., & Gollhofer, A. (2004). Impact of sensorimotor training on the rate of force development and neural activation. European journal of applied physiology, 92(1-2), 98-105.[PubMed]
- Gruber, M., Gruber, S. B., Taube, W., Schubert, M., Beck, S. C., & Gollhofer, A. (2007). Differential effects of ballistic versus sensorimotor training on rate of force development and neural activation in humans. Journal of strength and conditioning research, 21(1), 274.[PubMed]
- Ingebrigtsen, J., Holtermann, A., & Roeleveld, K. (2009). Effects of load and contraction velocity during three-week biceps curls training on isometric and isokinetic performance. The Journal of Strength & Conditioning Research, 23(6), 1670-1676.[PubMed]
- Lamont, H. S., Cramer, J. T., Bemben, D. A., Shehab, R. L., Anderson, M. A., & Bemben, M. G. (2010). Effects of adding whole body vibration to squat training on isometric force/time characteristics. The Journal of Strength & Conditioning Research, 24(1), 171-183.[PubMed]
- Lamas, L., Ugrinowitsch, C., Rodacki, A., Pereira, G., Mattos, E. C., Kohn, A. F., & Tricoli, V. (2012). Effects of strength and power training on neuromuscular adaptations and jumping movement pattern and performance. Journal of Strength & Conditioning Research, 26(12), 3335.[PubMed]
- Farup, J., Sørensen, H., & Kjølhede, T. (2014). Similar changes in muscle fiber phenotype with differentiated consequences for rate of force development: Endurance versus resistance training. Human movement science, 34, 109-119.[PubMed]
- Bazyler, C. D., Sato, K., Wassinger, C. A., Lamont, H. S., & Stone, M. H. (2014). The efficacy of incorporating partial squats in maximal strength training. Journal of strength and conditioning research/National Strength & Conditioning Association, 28(11), 3024.[PubMed]