Contents of Article
- Summary
- Introduction
- What is reliability?
- The 3 types of reliability
- Why is reliability important?
- How do you measure reliability?
- Is future research on reliability needed?
- Conclusion
- References
- About the Author
Summary
Precise measurements are central to sports science practice and research; however, error is an inherent part of testing. Reliability helps us understand the sources of error and how they affect findings in practice and in research. This article defines reliability and provides some key points for a better understanding of the statistical and practical concepts.

In sports science, testing is a central tool to support decisions made by practitioners and researchers alike. Scoring (X), for example, vertical jump height, is comprised of the true score (T) and the error (e), and it can be expressed in the following equation [1]:
X = T + e
Error is thought to originate in three main sources [2]:
- The participant: physiological and/or mental factors. For example, the stress of upcoming exams may decrease motivation and strength.
- The tester: change of technique or of judgment. For example, slightly modifying the way they use the skinfold calipers to measure body fat, resulting in biased readings.
- Technical error: due to the device used or the setup/environment. For example, if you step on a set of scales twice, only a few seconds apart, the readings will be different due to equipment measurement error, not weight change.
Error decreases the precision of a test and increases the smallest detectable change, making research and applied sport science less sensitive. For example, if a strength and conditioning coach monitors strength and finds a 5 kilogram (kg) increase in back squat one-repetition maximum (1RM), then:
- With a precision of ±2 kg they can confidently say that performance improved.
- With a precision of ±5 kg they cannot say that performance improved.
Error also impairs our ability to make predictions or to classify individuals, which may be a problem depending on the outcome and population. If a nutritionist measures body fat with a 5 % error (e.g. 26 % instead of 21 %), this could have profound effects on how the subject is classified. For example:
- Healthy professional football player: this may not be a big problem.
- An obese patient trying to lose weight.
To minimise error and improve clinical and research practices, standardisation and documentation of the following are critical:
- Test preparation: e.g. Familiarisation procedure and test timing.
- Testers training: g. Verification of Inter-tester reliability with the gold standard.
- Testing procedures: e.g. Implementation of an adequate and standardised warm-up.
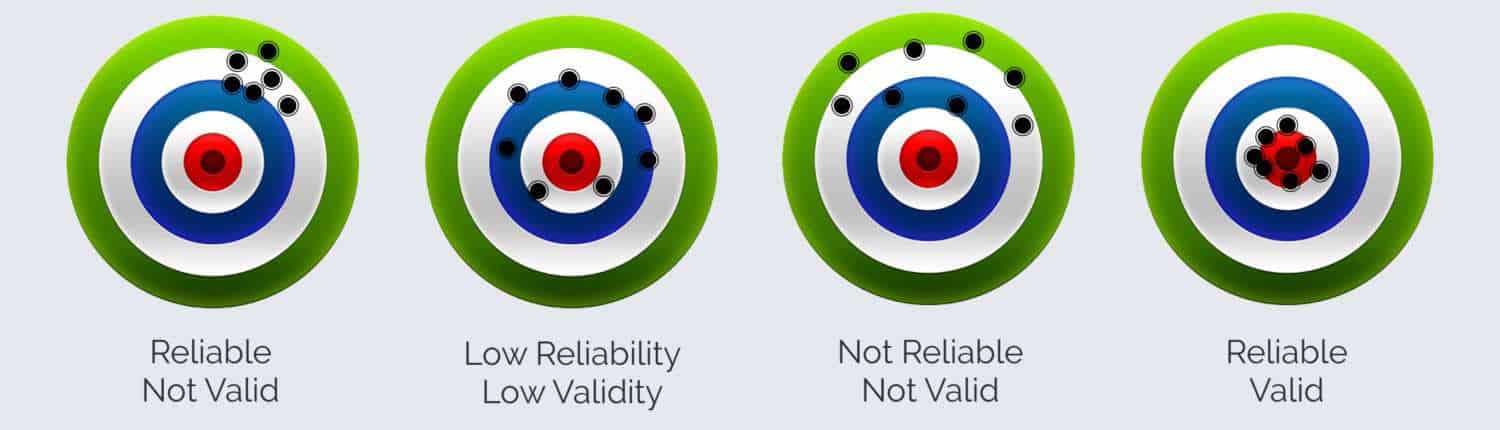
What is reliability?
Reliability is the study of error or score variance over two or more testing occasions [3], it estimates the extent to which the change in measured score is due to a change in true score. Theoretically, a perfectly reliable measure would produce the same score over and over again, assuming that no change in the measured outcome is taking place.
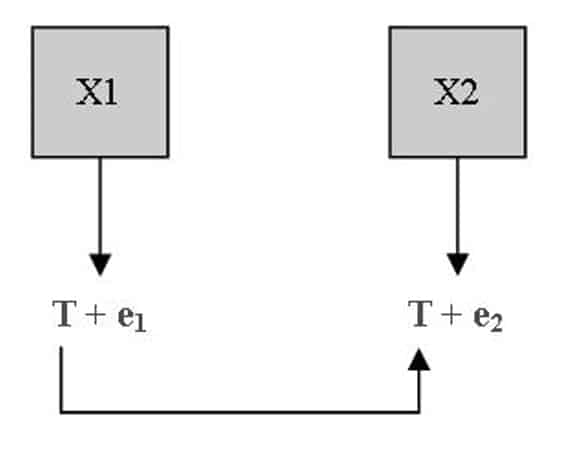
In the this schematic we can see:
- X1 and X2: The two repeated measurements on the same individual for the test (X)
- e1 and e2: The random errors for measurements 1 and 2, respectively.
- T: The true value of the test
This shows that practice is much more complex and that partitioning error and score variance may be challenging for the practitioner and the researcher alike.
Different terminologies are used and we will briefly differentiate them [4]:
- Repeatability is the variation in measurement for the same subjects under the same conditions over a short period of time [3] (e.g. the difference between two weightings, only a few minutes apart, on the same scale).
- Reproducibility is the variation in measurement for the same subjects under different conditions over a short period of time (e.g. the difference between two weightings, only a few minutes apart, on two different scales (inter-rater and methods comparisons).
It is important to understand that there are three types of reliability [5], all of which are discussed below.
The 3 types of reliability
One of the first things to learn when attempting to understand reliability is to know that there are three different types of reliability: Change in Mean; Correlation; and Within-Participant Variation.
Change in the Mean: Bias
As indicated in the name, it is the group mean change over two or more testing occasions and it has two components:
- Random error of measurement (e1 and e2 in the above diagram).
- Systematic change: change in the true value (T in the above diagram).
Correlation or Relative Reliability
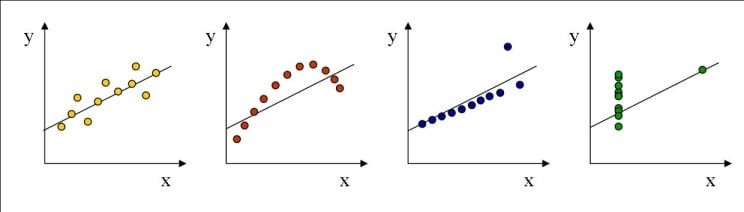
Intraclass Correlation Coefficient (ICC) is considered the most relevant indicator of relative reliability [2]. It measures the linearity of the relationship between two repeated measures and represents how well the rank order of participants in one trial is replicated in a second trial (e.g. runners performing a 5-kilometre (km) race twice and finishing with the same ranking)
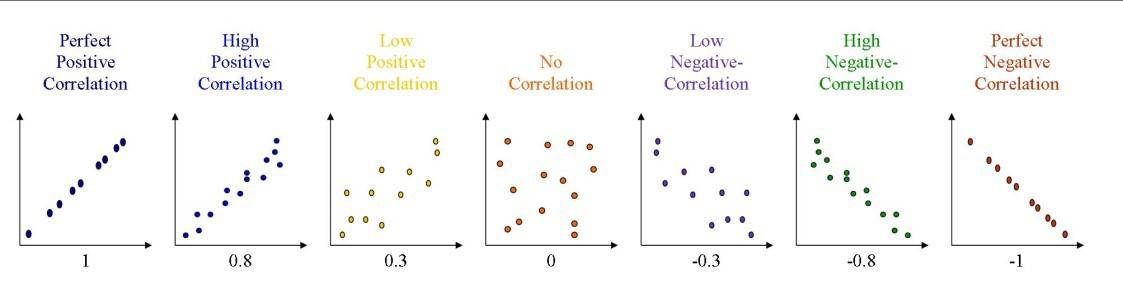
Figure 1 illustrates a variety of possible scenarios when repeated measures are plotted against each other. A straight and narrow line indicates the correlation is close to 1 or -1, whilst a cloud of data points demonstrates no relation (i.e. ICC closer to 0).
Within-Participant Variation: Absolute Reliability
Absolute reliability looks into the random error between repeated measures (e1 and e2) for one participant. Since it is expressed in the original unit (e.g. kg or centimetre (cm)), or in a proportion of it, it is useful to gauge the precision of a measure [2, 3]. It is, therefore, most relevant to assess the reliability of measures that evaluate change (e.g. tracking strength) [2, 3].
Next, we will briefly present the most common methods to investigate the within-participant variation:
Standard Error of Measurement (SEM)
The SEM is an estimate of the absolute value of the typical deviation between the observed scores and the true score, which is assumed to be the mean of all measured values [6].
Coefficient of Variation (CV)
The CV is the ratio of the SEM to the mean; it expresses the spread of values around the mean as a percentage of it (e.g. the CV of a fatigue protocol is 10 % of the total work performed).
Limits of Agreement (LOA)
The 95 % LoA is a range where we can expect someone’s test-retest values to fall 95 % of the time [5]. It is based on testing and can be calculated as follows:
Example:
The 95 % LoA for specific running task = ± 7 %
1st test score = 10 minutes (min) (600 seconds (s))
Because of this, and providing no change has occurred, we can expect the retest time to be in the range of plus or minus 7% of the 1st test score (10 min or 600 s).
[Mean -7 % (Mean) to Mean +7 % (Mean)].
[600 – (7*(600/100) = 558 s to (7*(600/100)) = 642 s)]
As a result, we can expect (95 % of the time) that the retest time will be between 9 min 18 s and 10 min 42 s. Practically speaking, this means that no change can be found to have taken place if retest values are within the above-mentioned range.
Why is reliability important?
Understanding and testing reliability is relevant for both the practitioner and the researcher when selecting a measure [3], since it provides insights into the biological (e.g. circadian rhythm), environmental (e.g. wind speed), and/or technical (e.g. timing gate height) factors influencing score variance [7].
For Practitioners/Coaches
Upon starting with a new team, practitioners need to determine the purpose of the testing (e.g. classifying athletes as needing an intervention or tracking progress). After this, the focus should be to review the literature to find the best test for the envisioned purpose(s) (i.e. which test is most reliable and valid).
In this process, close attention should be given to specific factors of the study (e.g. sample characteristics: Regional vs. Olympic Athletes or testing procedures: timing gate height). In fact, if those factors are different in the practice than in the study, the reliability of the findings cannot be expected to be similar. For example, if a professional footballer was to perform a 40 metre (m) sprint test using timing gates it may render an ICC of 0.75, but the same 40m sprint in high school athletes using a stopwatch will be much lower. This demonstrates the varying levels of reliability for the same test using different athletes and different equipment.
Finally, strict adherence to the procedures described in the supporting literature (e.g. equipment, test administrator, technical procedures, and familiarisation among many) is the key to best practice where results are reliable and valid [8].
For Researchers
In research, reliability is a useful tool to review the literature and help with study design.
Firstly, knowing about reliability will give insights into the relevance of results reported in the literature. For example, one can relate the change observed in an intervention study (e.g. + 10 %) to the reliability of the testing protocol used or cited. If the CV of the test is ± 6 %, a retest value of + 10 % is clearly within the range where we can feel confident that no change has occurred. The fact that it reached statistical significance only demonstrates sufficient statistical power, not clinical significance.
Secondly, to estimate sample size, a well-designed study should account for the precision of the measurement used [5, 9-11]. The less precise the measurement, the larger the sample size will have to be in order to have enough statistical power to see a significant effect.
In order to have reliable results that can be used to implement coaching strategies or to publish as scientific literature, the following rules and procedures need to be implemented and documented:
• Train your testers
- Document their training (e.g. duration and nature)
- Assess learning outcomes (e.g. checking mastery of testing procedure)
• Familiarise participants
- Use reference protocols (e.g. standardised warm-up)
- Familiarise with your test (e.g. conduct a ‘dummy run’ of the test before the study officially starts)
• Implement the actual test as a pilot study
- Analyse the results (i.e. Inter-tester reliability, data reliability)
• Address potential issues
- Modify testers training
- Address design issues (e.g. not enough rest time or unrealistic protocol)
How do you measure reliability?
In the previous section, we defined reliability and highlighted its importance; in the current section we will present the statistical methods used to gauge it, but first let us briefly introduce some of the statistical assumptions that we will refer to later on.
Assumptions
Statistical testing is based on assumptions. In case of deviations, appropriate measures need to be taken else inappropriate results and conclusions might be drawn [12].
Normality of distribution
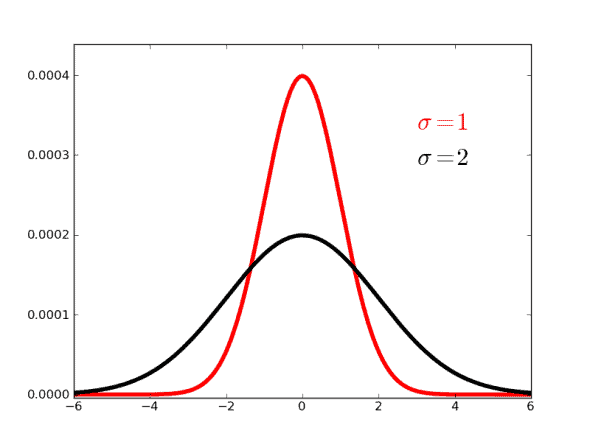
In a typical, normally distributed data set, a centred bell curve (Figure 2) demonstrates that 95 % of the cases revolve around the mean by ± 2 Standard Deviations (SD) [13]. In other words, when the data appears in a bell-shaped curve around the centre of the graph – as in Figure 2 – it suggests that 95 % of the data revolves around the mean by ± 2 SD. In this case, the normality of distribution can be assumed.
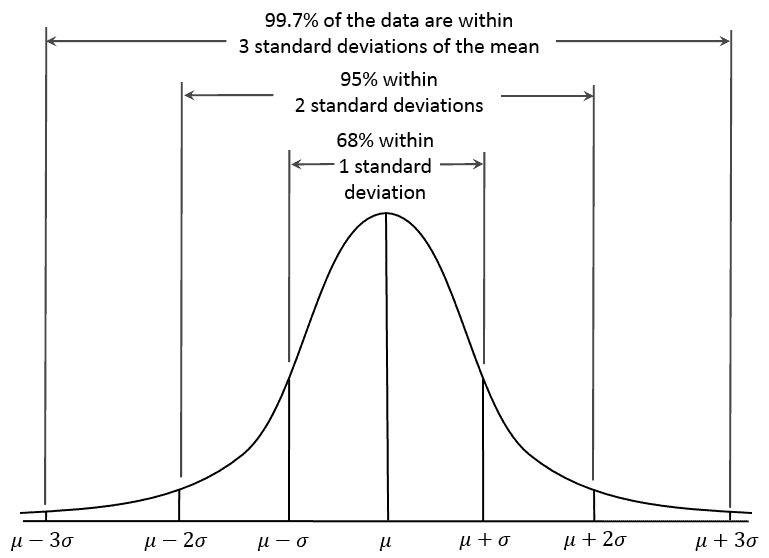
Distribution normality can be assessed visually or by using significance tests in software packages [12]. However, the distribution is not considered ‘normal’ if the bell curve is too pointy, too flat, or skewed (Figure 3).
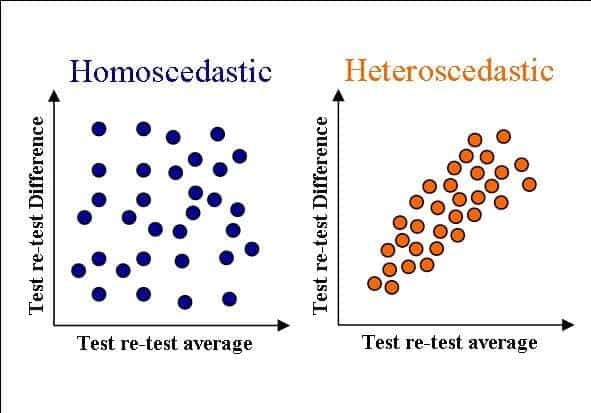
1. Homoscedasticity
The extent to which the size of the error (test-retest difference) is independent (i.e. not correlated) to the size of the tested value. Therefore, homoscedasticity is when the test-retest difference is similar for people who score high and for people who score low.
For example, during ergometer testing [5]:
- Stronger athletes (SA) have higher power outputs (453.1 Watts (W))
- Weaker athletes (WA) have smaller power outputs (378.6 W)
Homoscedasticity: SA have similar test-retest differences than WA (6.2 W vs. 6.1 W) (left part of the Figure 4).
Heteroscedascity: SA have greater test-retest differences than WA (6.1 W vs. 4.4 W) (right part of Figure 4).
Change in the Mean: Hypothesis testing for bias
A change in the group mean across testing occasions (tested with a t-test or analysis of variance (ANOVA)) can signify a systematic error which, depending on its size, may be a sign of design issues (e.g. an inconsistent testing environment). The acceptable size of the shift is decided by the researcher or the practitioner; however, it should really be as low as practically possible.
Although it is outside the scope of this article, it is interesting to note that the test of significance is influenced by the amount of random variation between tests, conversely, ANOVAs and t-tests assume, but are not very sensitive to, variations in normal distribution.
Calculations
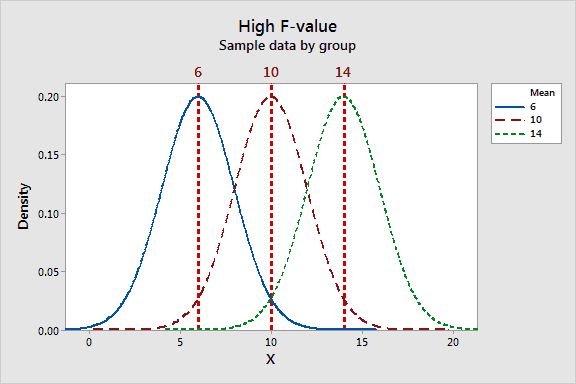
The determination of the significance for the ANOVA is based on the F ratio, calculated as follows:
F ratio = Between-day variance / Within-day variance
The F ratio describes the separation between the scores across the days. In the diagram below we can see a high F ratio, due to a good separation between the days (6, 10, 14) and a rather low variation within each day. Statistical packages will give a statistical significance value for this test.
Assumptions
Normality of distribution and homoscedasticity are assumed but ANOVA is generally considered to be quite robust to violations if the sample is relatively large [14
Interpretation
The practically acceptable bias size should be as low as possible, with the practitioner being the final judge of its appropriateness based on their expert opinion.
As previously mentioned, a change in the group mean across testing occasions suggests a systematic error which, depending on its size, may be due to design issues:
- Decreasing group mean: Due to fatigue carryover or lack of control of testing procedures. For example, inconsistency in the encouragement has a ± 5 % effect on strength performance [15].
- Increasing group mean: Due to a potentiating, training, or learning effect. For example, intelligence quotient (IQ) scores increase with repeated tests [16].
Limitations
When sample size increases, the random error component will tend to cancel out across participants (it is random, so eventually it cancels out). In turn, there is an increased probability of statistical significance despite minimal differences between the days [5]. However, with ANOVA, the practitioner is free to act or not upon finding a statistically significant shift depending on his or her perception of the importance of the results.
2. Correlation or Relative Reliability
Correlation measures assess the extent to which ‘Day 1’ and ‘Day 2’ measurements are associated. To do so, it compares the variation in data on the same day across the group to the sum of all variances.
Calculations
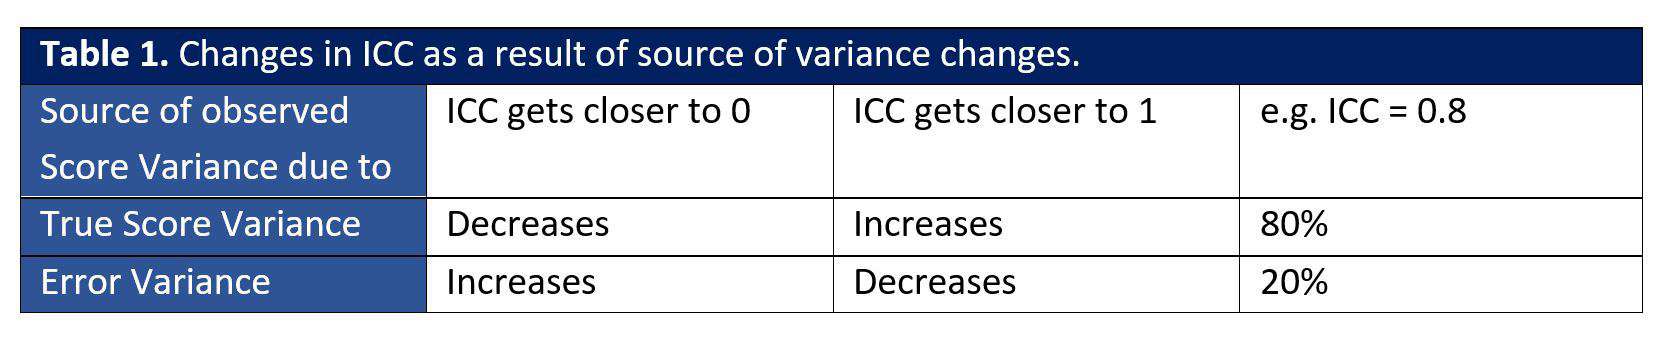
Intraclass correlation (ICC) = Between-day variance / (Within-day variance + Between-day variance)
The table below illustrates how the ICC changes when the source of variance changes. For example, true score variance decreases when ICC gets closer to 0.
When ICC is 0.8, 80% and 20% of the total variance are explained by true score and error variances, respectively.
Assumptions
Normality of distribution is assumed as in most parametric tests and similarly to the ANOVA since they have similar formulas.
Interpretation
The ICC is geared toward classification applications [3]. For example, classifying healthy versus pathologic shoulders when using a shoulder rotation test [2]. Several guidelines have been given for the classification of correlation coefficients [17].
- Poor correlation: < 0.50
- Moderate correlation: 0.50 – 0.75
- Good correlation: 0.75 – 0.90
- Excellent correlation: > 0.90
Limitations
The biggest limitation of the ICC is that it does not completely describe the relationship between the two variables, this is because it does not account for the slope of the line formed by the test-retest points (as illustrated below in Figure 6). For example, all four data sets in Figure 6 have an ICC of 0.86.
Also, the ICC has a tendency for overestimation when calculated on heterogeneous samples [18], and is therefore not the best tool to compare separate studies [5]. Finally, it does not represent agreement between testing occasions [19].
3. Within-Participant Variation: Absolute Reliability
While the previous sections discussed inter-individual comparisons (i.e. variation between participants), this section will focus on the variation associated with just one participant (i.e. the within-participant variation).
Standard Error of Measurement (SEM)
Calculations
The error of measurement is the root mean square average of each individual standard deviation as exemplified below in Figure 7.
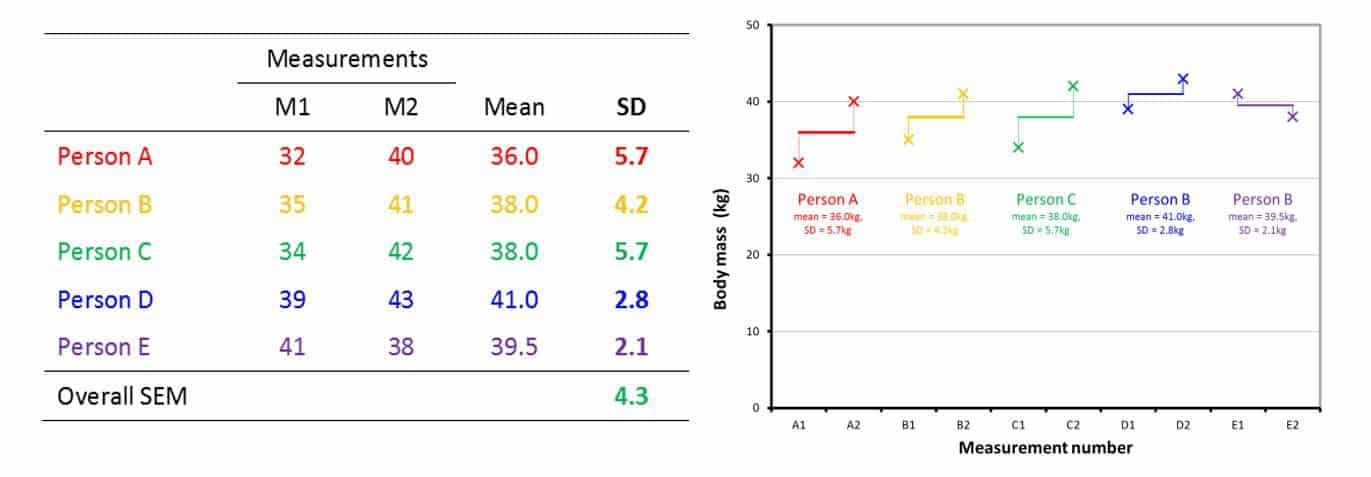
The overall SEM is calculated as the root mean square average of all standard deviations:
SEM = √ ((5.7² + 4.2² + 5.7² + 2.8² + 2.1²) / 5)} = 4.3
Assumptions
No specific assumptions.
Interpretation
For a more practical outlook, practitioners can base their judgement of appropriateness on confidence intervals (CI) calculated as shown below:
- 68 % CI = Score ± SEM
- 95 % CI = Score ± (1.96 * SEM)
- 99 % CI = Score ± (2.58 * SEM)
For example, if isokinetic quadriceps strength measured is 140 Newton metres (Nm) and the specific test SEM is 15 Nm, statistical theory tells us that we can be 68 % confident that true score is between: (140 – 15 = 125 and 140 + 15 = 155).
Based on an actual result of = 125 Nm < Quadriceps Strength < 155 Nm, the practitioner can assess whether the test is reliable and precise enough for the specific purpose and outcome.
Limitations
The SEM is expressed in the measured unit (e.g. distance or Watts), so that:
- The characteristics of the participants need to be accounted for when comparing the same test across different populations [5].
- The dimension of the test values (calibration or scaling across ergometers and analysers) needs to be accounted for when comparing the same population across different tests [5], as differences in scales will affect SEM size.
Coefficient of Variation (CV)
Calculations
The CV can be easily calculated using the following formula:
CV = SEM / mean * 100
Using the example from the previous section and the data from Figure 7, the CV can be calculated as follows:
(SEM = 4.3, Mean = (36 + 38 + 38 + 41 + 39.5) / 5 = 38.5)
CV = (4.3 / 38.5) * 100 = 11.17%
CV = 11.17%
Assumptions
CV assumes homoscedasticity after accounting for the mean, the population of tests for each individual, as well as normality of distribution.
Interpretation
Hopkins [5] uses an ergometer-based test to demonstrate the relevance of CV. Two groups of strong (SA) and weaker athletes (WA) perform the same test. The table below shows the results:
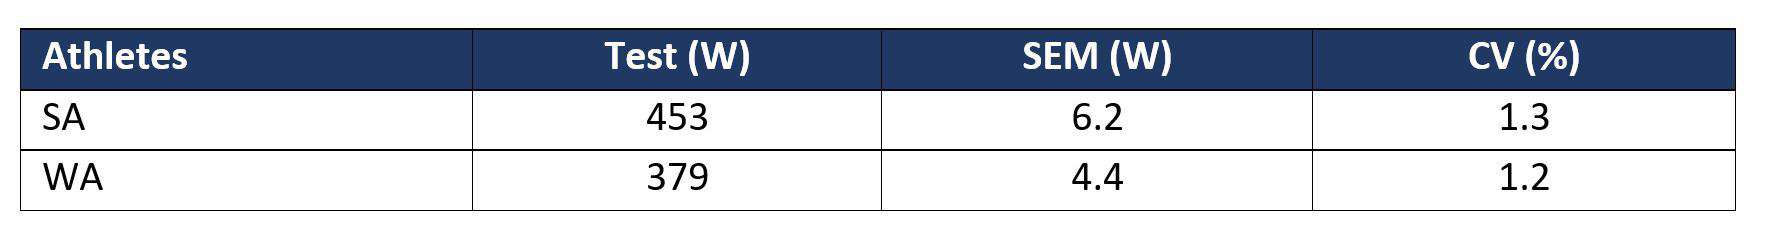
We can see that the test appears to have lower reliability for the SA than for WA, until we examine the CV which actually renders the opposite picture and shows that the reliability of the test is similar for SA and LSA.
CV is a dimensionless statistic and has great appeal to compare the reliability of different measurement tools [5]. Some have suggested 10% or less as an acceptable value for CV [21], however, the decision and rationale belong to the practitioner and will be largely a function of the testing aims.
With the CV, we can also use confidence intervals as described for the SEM: a CV of 10 % means that [9] we can be 68% sure that a true test score will be between a measured value ± 10 % of the mean.
Limitations
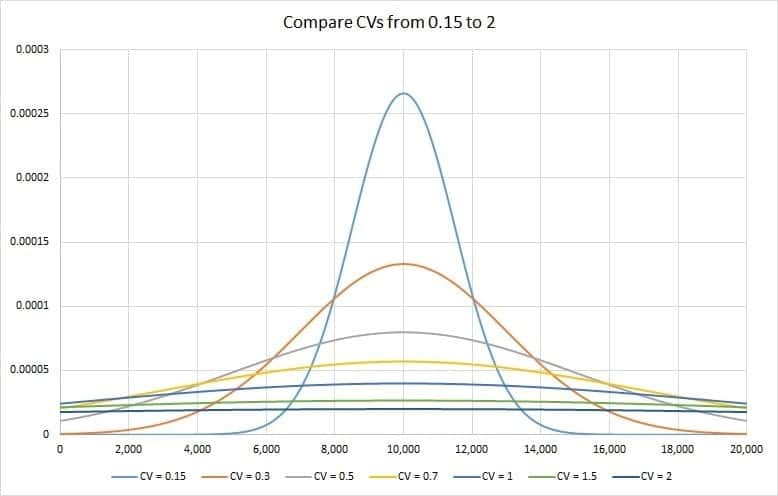
The graph below shows that the lower the CV, the tighter the spread around the mean. This means that practitioners should be aware of the difference in precision that having an increase of 0.15 in CV induces.
Limits of Agreement (LOA)
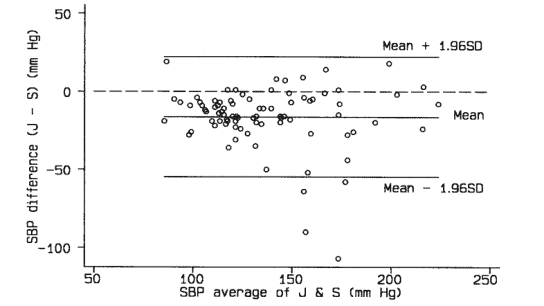
Bland and Altman who introduced this measure, thought that looking at the range where an individual test score would fall 95% of the time may be more relevant than comparing test and retest.
Calculations
The Bland–Altman method is a two-step plotting process:
- Plot data points of each participant:
- x-axis: mean of the test-retest
- y-axis: difference of the test-retest
- Draw three lines representing group data:
- The Mean: difference between test and re-test (the ‘bias’)
- The Upper limit: The Mean + 1.96 * SD of test re-test differences
- The Lower limit: The Mean – 1.96 * SD of test re-test differences
Assumptions
This method assumes normality and homoscedasticity. It is recommended that a large sample size (n > 40) is used to avoid bias and facilitate comparisons between studies [5].
Interpretation
On the basis of two trials with X number of participants, when we test and re-test another participant the score in the second trial has a 5% chance, or 1 chance in 20, of being correct [5]:
> Score of 1st test + the Upper Limit
OR
< Score of 1st test – the Lower Limit
Limitations
LoA are considered by some as a reference when looking at absolute agreement between two testing occasions [9], yet it is largely disregarded by others [5]. Hopkins [5] argues that the 95 % LOA maybe not be precise enough to monitor changes in performance in elite athletes. Hopkins [5] also argues that the 95 % LoA are sensitive to sample size and show decreasing values with increasing sample size. Arguably, they might not be the best indicator of precision for one single trial as their main purpose is to provide a range in which the value of a re-test is expected to fall based on a test [5].
To conclude, there is not one best approach, and the practitioner/researcher should look carefully at both the absolute and relative reliability of a test and possibly present an extensive analysis in a detailed yet readable format to allow for comparisons. Care should be taken when extrapolating the findings of reliability studies, since findings are test- and sample-specific [23].
Is future research on reliability needed?
Field testing is the key to detecting the worthwhile and externally valid effects that are the focus of applied research [24, 25]. However, the precision of findings is altered due to the lack of control on extraneous variables and to the multiplication of error sources (e.g. low sampling rate) [24, 25]. To address this issue, we suggest studying the reliability and validity of applied research methods. Separating the different sources of error will help find practices that could increase precision (e.g. creating interpolation techniques to replace missing data).
We know that a familiarisation protocol decreases systematic bias in reliability studies, however, we do not know precisely why, or how, it works. Future investigations should examine the mechanisms which lead to test improvements observed following familiarisation for specific tests (e.g. decreased apprehension in a new environment like the laboratory or performing in front of a group). This will give better insights into the aspects that should be of focus, and will potentially create a roadmap to improve the effectiveness of familiarisation.
Conclusion
Reliability is the study of testing error and can be assessed using various statistical methods. Rather than common practices, research means and outcomes should guide the choice for the practitioner. Practically, the investigation of differences between groups or between time points must be preceded by a careful study of the reliability of the envisioned testing means.
Together with a very homogenous group, a reliable test will increase the chances of finding test-retest differences for a training intervention.
- Payne, R.W., Reliability theory and clinical psychology. J Clin Psychol, 1989. 45(2): p. 351-352. http://www.ncbi.nlm.nih.gov/entrez/query.fcgi?cmd=Retrieve&db=PubMed&dopt=Citation&list_uids=2723095
- de Vet, H.C.W., et al., When to use agreement versus reliability measures. Journal of Clinical Epidemiology, 2006. 59(10): p. 1033-1039. http://dx.doi.org/10.1016/j.jclinepi.2005.10.015
- Bartlett, J.W. and C. Frost, Reliability, repeatability and reproducibility: analysis of measurement errors in continuous variables. Ultrasound Obstet Gynecol, 2008. 31(4): p. 466-475. http://www.ncbi.nlm.nih.gov/entrez/query.fcgi?cmd=Retrieve&db=PubMed&dopt=Citation&list_uids=18306169
- Taylor, B.N. and C.E. Kuyatt, Guidelines for Evaluating and Expressing the Uncertainty of NIST Measurement Results. NIST Technical Note, 1994. https://www.nist.gov/pml/nist-technical-note-1297.
- Hopkins, W.G., Measures of reliability in sports medicine and science. Sports Med, 2000. 30(1): p. 1-15. http://www.ncbi.nlm.nih.gov/entrez/query.fcgi?cmd=Retrieve&db=PubMed&dopt=Citation&list_uids=10907753
- Dudek, F.J., The continuing misinterpretation of the standard error of measurement. Psychological Bulletin, 1979. 86(2): p. 335-337.
- Bagger, M., P.H. Petersen, and P.K. Pedersen, Biological variation in variables associated with exercise training. Int J Sports Med, 2003. 24(6): p. 433-40. http://www.ncbi.nlm.nih.gov/entrez/query.fcgi?cmd=Retrieve&db=PubMed&dopt=Citation&list_uids=12905092
- Currell, K. and A.E. Jeukendrup, Validity, reliability and sensitivity of measures of sporting performance. Sports Med. 2008;38(4):297-316., 2008. https://www.ncbi.nlm.nih.gov/pubmed/18348590
- Atkinson, G. and A.M. Nevill, Statistical methods for assessing measurement error (reliability) in variables relevant to sports medicine. Sports Med, 1998. 26(4): p. 217-238. http://www.ncbi.nlm.nih.gov/entrez/query.fcgi?cmd=Retrieve&db=PubMed&dopt=Citation&list_uids=9820922
- Bates, B.T., J.S. Dufek, and H.P. Davis, The effect of trial size on statistical power. Med Sci Sports Exerc, 1992. 24(9): p. 1059-1065. https://www.ncbi.nlm.nih.gov/pubmed/1406191?dopt=Citation
- Dufek, J.S., B.T. Bates, and H.P. Davis, The effect of trial size and variability on statistical power. Med Sci Sports Exerc, 1995. 27(2): p. 288-295. http://www.ncbi.nlm.nih.gov/entrez/query.fcgi?cmd=Retrieve&db=PubMed&dopt=Citation&list_uids=7723655
- Ghasemi, A. and S. Zahediasl, Normality tests for statistical analysis: a guide for non-statisticians. Int J Endocrinol Metab, 2012. 10(2): p. 486-489. http://www.ncbi.nlm.nih.gov/entrez/query.fcgi?cmd=Retrieve&db=PubMed&dopt=Citation&list_uids=23843808
- Winter, E.M., R.G. Eston, and K.L. Lamb, Statistical analyses in the physiology of exercise and kinanthropometry. J Sports Sci, 2001. 19(10): p. 761-775. http://www.ncbi.nlm.nih.gov/entrez/query.fcgi?cmd=Retrieve&db=PubMed&dopt=Citation&list_uids=11561673
- Wilcox, R.R., The goals and strategies of robust methods. British Journal of Mathematical and Statistical Psychology, 1998. 51(1): p. 1-39. http://dx.doi.org/10.1111/j.2044-8317.1998.tb00659.x
- McNair, P.J., et al., Verbal encouragement: effects on maximum effort voluntary muscle action. Br J Sports Med, 1996. 30(3): p. 243-245. http://www.ncbi.nlm.nih.gov/entrez/query.fcgi?cmd=Retrieve&db=PubMed&dopt=Citation&list_uids=8889120
- Estevis, E., M.R. Basso, and D. Combs, Effects of practice on the Wechsler Adult Intelligence Scale-IV across 3- and 6-month intervals. Clin Neuropsychol, 2012. 26(2): p. 239-254. http://www.ncbi.nlm.nih.gov/entrez/query.fcgi?cmd=Retrieve&db=PubMed&dopt=Citation&list_uids=22353021
- Portney LG, W.M., Foundations of clinical research: applications to practice. 2000, New Jersey: Prentice Hall.
- Bates, B.T., et al., The effects of sample size and variability on the correlation coefficient. Med Sci Sports Exerc, 1996. 28(3): p. 386-391. http://www.ncbi.nlm.nih.gov/entrez/query.fcgi?cmd=Retrieve&db=PubMed&dopt=Citation&list_uids=8776228
- Bland, J.M. and D.G. Altman, Statistical methods for assessing agreement between two methods of clinical measurement. Lancet, 1986. 1(8476): p. 307-310. http://www.ncbi.nlm.nih.gov/entrez/query.fcgi?cmd=Retrieve&db=PubMed&dopt=Citation&list_uids=2868172
- Richard, B. CALCULATING THE SEM. 2016 [cited 2018; Available from: https://wwrichard.net/2016/06/01/calculating-the-sem/
- Bishop, D., Reliability of a 1-h endurance performance test in trained female cyclists. Med Sci Sports Exerc, 1997. 29(4): p. 554-559. http://www.ncbi.nlm.nih.gov/entrez/query.fcgi?cmd=Retrieve&db=PubMed&dopt=Citation&list_uids=9107640
- Sujit, S. Do You Use Coefficient Of Variation To Determine Forecastability? 2015 [cited 2018; Available from: https://blog.arkieva.com/do-you-use-coefficient-of-variation-to-determine-forecastability/.
- Hopkins, W.G., E.J. Schabort, and J.A. Hawley, Reliability of power in physical performance tests. Sports Med, 2001. 31(3): p. 211-234. http://www.ncbi.nlm.nih.gov/entrez/query.fcgi?cmd=Retrieve&db=PubMed&dopt=Citation&list_uids=11286357
- Atkinson, G. and A.M. Nevill, Selected issues in the design and analysis of sport performance research. J Sports Sci, 2001. 19(10): p. 811-827. http://www.ncbi.nlm.nih.gov/entrez/query.fcgi?cmd=Retrieve&db=PubMed&dopt=Citation&list_uids=11561675
- Thomas, A., B. Dawson, and C. Goodman, The Yo-Yo Test: Reliability and Association With a 20-m Shuttle Run and VO2max. International Journal of Sports Physiology & Performance, 2006. 1(2): p. 137-149. https://pubmed.ncbi.nlm.nih.gov/19114746/.