The Best Way to Visualise Testing Data
Truly grab coach and athlete attention with Athlete Performance Indexes
By Will Saville
Last updated: March 17th, 2025
6 min read
- Introduction
- Athletic Performance Indexes
- Identifying Key Performance Indicators
- Weighing Tests
- An Example
- A Practical Solution to the Data Blues
- Conclusion
- About the Author
- References
- Comments

Introduction
In today’s world of sports performance, data is essential. Without data, you cannot gain insight into the physical journey athletes are on and if they are improving, getting worse or staying the same. Gathering the data already presents a plethora of challenges, but presenting that data, and using it effectively is the real challenge.
This article aims to serve as a resource for coaches who may not have the resources or opportunity to work with data specialists or high-priced data management systems. It will provide you with practical information on how to get your athletes and coaches to understand and value the data collected.
Athletic Performance Indexes
Athletic Performance Indexes (APIs) are intended to be a comprehensive collection of data that gives a holistic representation of an athlete’s physical (and sometimes mental) capabilities. Depending on the API, these data sets may be sport-specific, or they may be generalized and geared toward more foundational athletic qualities. Scoring is usually on a scale from 0 – 100, 100 being the best score possible.
[optin-monster-shortcode id=”ogrxs2wlfenhxsneemj2″]
Identifying Key Performance Indicators
An API should be built with Key Performance Indicators (KPIs) specific to the sport or position being analysed (7). In the sport performance world, some common KPIs are speed, strength, balance, mobility, stability, power, etc. KPIs may even be more specific, such as shoulder stability, ankle mobility, horizontal power or single-leg strength. The KPIs used in an API should be determined through the completion of a comprehensive needs analysis of the demands of the sport, along with coaching experience.
For example, generally in lacrosse, the physical attributes involved are speed, horizontal power (acceleration), anaerobic and aerobic capacity, strength (upper and lower body), and change of direction (1, 5). Whichever KPIs you choose should be determined by an evidence-based needs analysis, your personal experience working in the sport, expert opinion in the field, and the coaches you’re working with.
The importance of involving head coaches when establishing KPIs is threefold;
1) It involves them in the process which makes the final product easier to understand.
2) It gives them a sense of ownership in the testing process, which in my experience, leads to higher precedence set on data and testing weeks.
3) Coaches may use tactics which mean certain KPIs are more important (e.g. if high running and pressing are involved) then aerobic and anaerobic capacity may be a major part of the API.
In certain sports, some qualities are more important than others. Upper body strength is much more important in American football as opposed to football (soccer). This means when designing an API, some KPIs must be weighted differently from others.
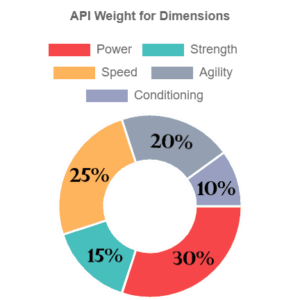
This API is designed for a general lacrosse athlete. This weighting structure can be developed through a need analysis of the physical demands of the sport, speaking to other professionals who work with the sport (including sports coaches), in addition to considering the coach’s own experience with the sport.
KPIs may be organized differently based on specific positions within the same sport. For example, in American Football, an Offensive Lineman’s API and a Defensive Back’s API are going to look far different. An Offensive Lineman’s API may weigh Upper Body strength as the most influential KPI, whereas in the Defensive Back’s API, the most influential KPI could be speed or change of direction (8).
[optin-monster-shortcode id=”y8t9ew2bizyaqwq61dtr”]
Weighing Tests
Once a coach has weighed the KPIs in order of importance for their assigned sport and developed a valid and reliable testing battery, it is time to weigh each test. To weigh a test, one must establish parameters; a best, a worst, and an average score. Establishing these values will allow whichever system used to recognize and establish a score for the athlete’s raw data. A coach may use normative data, if any is available on the test, or they may use their data gathered throughout the years to set these parameters for each test. Each test will likely have different normative values based on skill level, sport, sex, position and so forth (3, 6). For instance, the average back squat for a high school American Football player is different from the average back squat for collegiate American Football players (8). To go even further, the average back squat for high school Running Backs is different than the average back squat for high school Linebackers. These variables must be considered when establishing your parameters for each test.
Once the parameters are established for each test, the athlete’s raw data can be converted into a score representing how well the athlete has performed compared to the rest of the data set, or a global data set, for that specific test. The score on each test will subsequently lead to a score on the KPI being tested, which will subsequently lead to the overall API score.
An Example
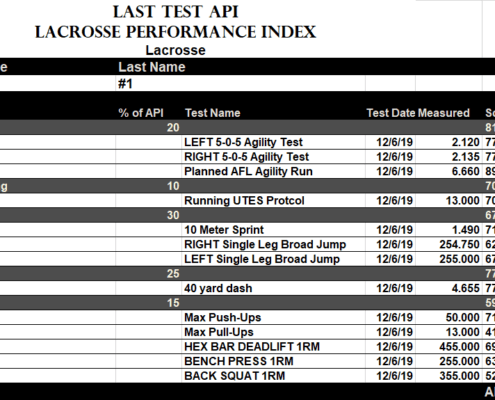
Below is an example of a Lacrosse athlete’s KPIs and the tests used for these KPIs. An API document like this can be provided to each athlete. Each KPI is weighed and each test still provides a raw score.
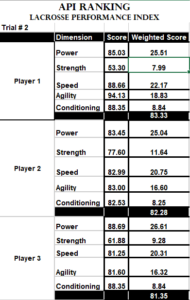
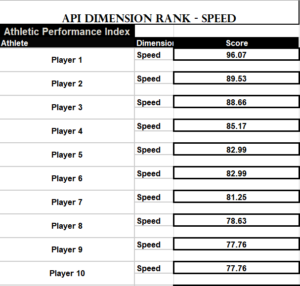
It’s also important to know the audience the data is for; a sports coach may find it hard to digest all this information for each player. As such, something more generalized and easier to understand can be provided to coaches such as a ranking of players for each KPI, with an example below.
A Practical Solution to the Data Blues
Most coaches don’t see the importance of fancy metrics or how much better an athlete’s squat has increased. It also isn’t their job to know if going from a 4.83-second 40-yard dash to 4.77 seconds is a significant change (4, 2). What coaches do understand and want to know is if athletes are improving and if it’s going to make a difference on the field with KPIs that have an impact on the sport (e.g. speed, agility and strength) (1, 8) and how players are ranking against others using scoring systems such as a 0 to 100 ranking.
For example, reporting a player went from a 50.7 to a 53.46 in their API, or the team as a whole improved from a 60.23 to a 61.45 will help coaches easily grasp the importance of the results presented, especially if the sports coaches were involved in the process of developing the API.
Conclusion
APIs can change the way coaches interpret testing data and streamline the entire process from data analysis to presenting the APIs to athletes and coaches in a way that will engage athletes and help coaches understand if athletes are improving.
[optin-monster-shortcode id=”jfjucvkw2z2xvy5rxqz2″]
Will Saville
More content by WillReferences
- Akiyama, K., Sasaki, T., & Mashiko, M. (2019). Elite Male Lacrosse Players’ Match Activity Profile. Journal of sports science & medicine, 18(2), 290.
- Clark, K. P., Rieger, R. H., Bruno, R. F., & Stearne, D. J. (2019). The National Football League Combine 40-yd dash: how important is maximum velocity?. The Journal of Strength & Conditioning Research, 33(6), 1542-1550.
- Haff, G., Triplett, N. T. (2016) Essential of Strength and Conditioning. Champaign, IL: Human Kinetics.
- Moir, G., Button, C., Glaister, M., & Stone, M. H. (2004). Influence of familiarization on the reliability of vertical jump and acceleration sprinting performance in physically active men. Journal of strength and conditioning research, 18(2), 276-280.
- Polley, C. S., Cormack, S. J., Gabbett, T. J., & Polglaze, T. (2015). Activity profile of high-level Australian lacrosse players. The Journal of Strength & Conditioning Research, 29(1), 126-136.
- Tanner, R. K., & Gore, C. J. (2013). Physiological tests for elite athletes. Champaign, IL: Human Kinetics
- Turner, A. N. (2014). Total Score of Athleticism: a strategy for assessing an athlete’s athleticism. Professional Strength & Conditioning, (33), 13-17.
- Williford, H. N., Kirkpatrick, J., Scharff-Olson, M., Blessing, D. L., & Wang, N. Z. (1994). Physical and performance characteristics of successful high school football players. The American journal of sports medicine, 22(6), 859-862.