This week in the world of sports science, here’s what happened…
- An example of an England rugby conditioning session
- Countermovement jump normative data for basketballers
- Shuyao Chen’s data analysis of the European Football Championship
An example of an England rugby conditioning session
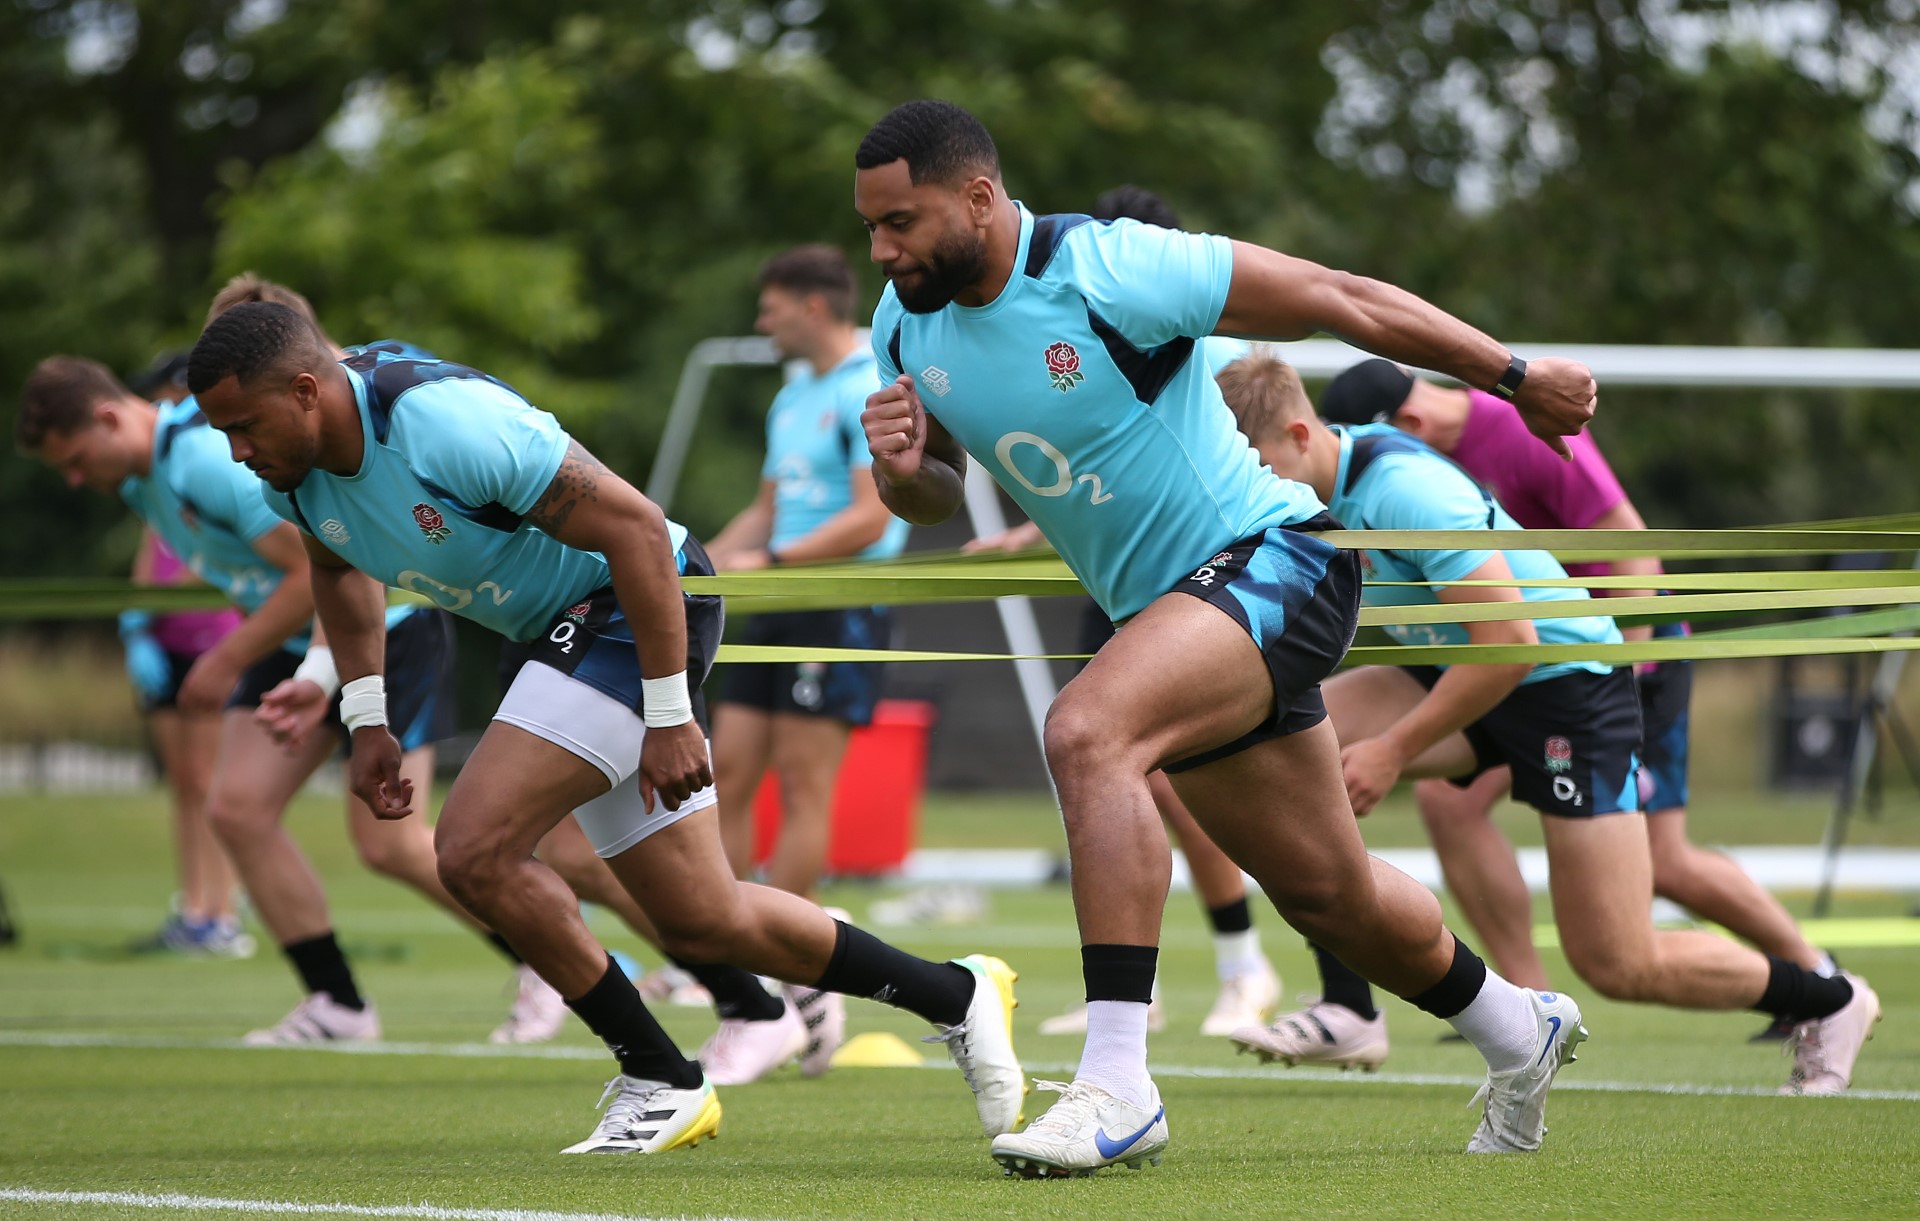
A recent YouTube video has generated significant attention online. The Times’ rugby correspondent, Will Kelleher, visited Aled Walters, the Head of Strength and Conditioning for England’s men’s rugby team. In the video, Walters puts Kelleher through a conditioning session for the England rugby team.
Initially, Kelleher undergoes an intensive workout on the Watt bike. He is directed to pedal at maximum intensity for 10 seconds, with the goal of covering a distance of 200 meters within this timeframe. Following each repetition, Kelleher is allowed 20 seconds of rest before starting the next repetition. Unfortunately for Kelleher, eight repetitions were programmed! Walters notes that elite English rugby players can achieve a cumulative distance of nearly 1700 meters across the eight repetitions. The video employs astute visual representations to portray Kelleher’s decline in performance as he progresses through the repetitions.
Subsequently, Walters introduces Kelleher to “The Grid,” comprising four game-based exercises to be executed at maximum intensity for 10-second intervals. These exercises encompass sled pushes, multi-directional running around cones, tackle bag slams, and medicine ball carries, complemented by repeated transitions from the ground to a standing position. “The Grid” is designed to enhance rugby-specific skills and fortify players’ capacity to swiftly rise from a tackle or breakdown situation.
If you are interested in rugby, this video is definitely worth watching as it provides a glimpse into the intense conditioning required to be an English rugby player!
Countermovement jump normative data for basketballers

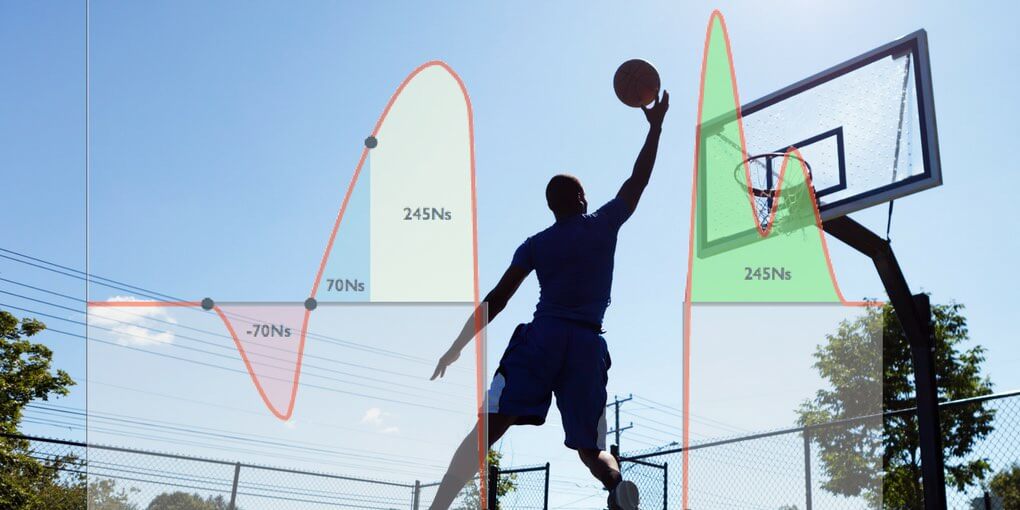
An interesting recent study provided a comprehensive analysis of normative data for the countermovement jump among high-level basketball players. It was recently published in the International Journal of Strength and Conditioning. The research involved 96 NCAA Division-I basketball players from seven teams, with countermovement jump (hands on hip) data being collected during the pre-season using Hawkin Dynamics force plates.
Notably, the paper stands out for its exceptional visual presentation, featuring a wealth of graphs that are visually appealing and easily comprehensible. For enthusiasts of countermovement jump data, the study offers substantial information on jump height, momentum, impulse, peak velocity, braking and propulsive metrics, and more. The data is presented in tables with visual aids, effectively illustrating percentiles ranging from poor to good.
The paper provides an in-depth analysis of the variations in countermovement jump metrics between forwards and centres, catering to basketball enthusiasts. However, the study is limited by the absence of data for basketball guards, with only four guards included out of 96 participants, which is a notable shortcoming. Despite this limitation, the research contributes valuable normative data for basketball players in a widely used athletic performance test. It also offers a comprehensive analysis of data obtained from force plates, the gold standard for measuring the countermovement jump.
We highly recommend checking out the PDF version of the study to see its exceptional visual analysis! If you are interested in force plates, why not check out our excellent course on force plates (click here)
Shuyao Chen’s data analysis of the European Football Championship

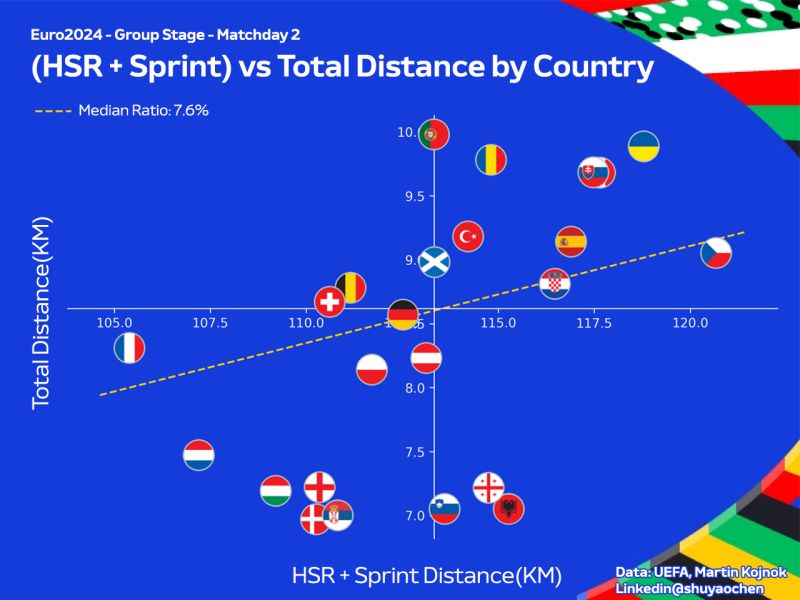
While we are on the subject of data analysis and presentation, we must acknowledge the remarkable contributions made by Shuyao Chen on LinkedIn. With the European Football Championships now in its advanced stages, Chen has consistently provided exceptional data analysis throughout the tournament.
Chen has shared remarkably insightful data analyses on her LinkedIn profile, including detailed assessments of high-intensity running and total running distances for individual players, as well as comparisons between teams. The visual presentation of this data has proven to be exceedingly effective, presenting statistics in a visually compelling manner.
If you are interested in football or data analysis, check out Chen’s work on LinkedIn here! Perhaps the statistics could provide a clue about the potential winner!
From us this week:
>> New course: Investigating S&C Practices
>> New podcast: Elite Rest: The Science Of Recovery In Sport
>> New infographic: Is The Apple Watch A Valid Option For Velocity Based Training?
>> New article: TeamBuildr: Everything You Need To Know
Access to a growing library of sports science courses
SFS Academy is an all-access membership to premium sports science education.
With SFS Academy, you’ll learn from some of the best coaches around the world as they teach you how to apply the latest research and practice with your athletes.


