Contents
- Introduction
- What is Power BI and what is it used for?
- Is Power BI a database?
- What is DAX in Power BI?
- Is Power BI better than Excel and Tableau?
- Is Power BI easy to learn?
- How to use Power BI in Sports
- How to learn Power BI
- Conclusion
Introduction
Microsoft’s Power BI (standing for Power Business Intelligence) has emerged as a potent tool, offering sports organisations a comprehensive solution for visualising, and analysing data. In the ever-evolving landscape of sports analytics, data-driven insights play a pivotal role in shaping team strategies, optimising player performance, and gaining a competitive edge. This article explores what Power BI is, its functionalities, and its specific applications in the realm of sport science, incorporating insights from research studies in the field.
What is Power BI and what is it used for?
What is Power BI?
At its core, Power BI is a business analytics tool developed by Microsoft that enables organisations to connect to various data sources, transform raw data into meaningful insights, and create interactive reports and dashboards. It offers a suite of components, including Power BI Desktop for creating data models, Power BI Service for collaboration and sharing, and Power BI Mobile for on-the-go access. The tool’s versatility and integration capabilities make it a valuable asset in the sport science world. Power BI’s applications in sport science extend far beyond traditional data analysis tools. Researchers and sports analysts leverage Power BI to integrate and analyse data from several sources, ranging from player performance metrics and training loads to injury records and game audits. This holistic approach to data empowers sports organisations to make informed decisions , enhance training strategies, and prevent injuries [1].
Functionality
Data Integration – Power BI facilitates seamless integration with various data sources, including wearables, GPS systems, and game databases. This integration allows sports scientists to aggregate diverse datasets for comprehensive analysis.
Data Modelling – The Data Analysis Expressions (DAX) language within Power BI enables the creation of custom calculations and measures. This functionality is invaluable for sports analysts, allowing them to derive advanced performance metrics and insights.
Performance Analysis – Power BI empowers sports organisations to conduct in-depth performance analysis. Coaches can visualise player movements, assess key performance indicators, and identify patterns that contribute to in-game decision-making.
Training Load Monitoring – By integrating data from GPS Systems and monitoring tools, Power BI aids in tracking and optimising training loads. This functionality is crucial for preventing overtraining, ensuring peak performance, and minimising the risk of injuries.
Injury Prevention – Power BI’s capabilities extend to injury prevention. By analysing historical injury data alongside training loads and fitness levels, sports scientists can identify risk factors and implement targeted strategies to mitigate injuries.
Real-Time Dashboards – The creation of real-time dashboards in Power BI allows for instantaneous monitoring of player metrics during training sessions and games. This real-time visibility enables quick adjustments to strategies based on emerging insights.
As sports science continues to embrace the power of data, Power BI emerges as a crucial tool, unleashing the potential of athletic performance and contributing to the ongoing evolution of sports analytics.

Is Power BI a database?
At its essence, Power BI is not a database in itself but rather a robust business intelligence and data visualisation tool. Its primary function is to connect to various data sources, transform raw data into actionable insights, and present these insights through interactive reports and dashboards. Power BI serves as the bridge between data sources and meaningful visualisations, facilitating comprehensive analysis for decision-makers in sports organisations. While Power BI is not a database, it seamlessly integrates with databases to extract and analyse data. In the context of sport, this integration is crucial [2]. Power BI connects to a diverse range of data sources [3], including player performance databases, training load repositories, and injury records. This connectivity enables data analysts to create unified, comprehensive views of athlete data.
Although Power BI is not a database, databases play a crucial role in providing data for analysis and visualisation within Power BI. It will allow users to connect to a variety of databases to import, transform and analyse their data. It can connect to both on-premises and cloud-based databases including SQL servers [4] and more.
What is DAX in Power BI?
In the dynamic landscape of sports analytics, where every data point holds the potential to uncover insights that can redefine strategies and enhance player performance, the term DAX takes centre stage. Data Analysis Expressions, or DAX, is not merely an acronym but a powerful language within Microsoft’s Power BI.
DAX, short for Data Analysis Expressions, is a formula language designed to facilitate advanced calculations and aggregations in Power BI, allowing users to create custom measures and calculated columns. DAX operates in the background, empowering analysts to derive meaningful metrics and insights from raw data [5]. You can use DAX to draw insights from relevant research studies and showcase its role as a game-changer in deriving actionable insights.
In the realm of sport science, where the ability to derive nuanced performance metrics is crucial, DAX emerges as a fundamental tool. Researchers and sports analysts utilise DAX to create custom calculations that go beyond standard data summaries. Whether it’s calculating athlete workload, analysing biomechanical parameters, or predicting injury risks, DAX serves as the language that translates raw data into actionable insights.
The Power of DAX in Sport
Custom Metrics Creation – DAX enables you to go beyond standard performance metrics. By creating custom measures, analysts can derive metrics tailored to the specific needs of their sport or team. For example, calculating the efficiency of a football player in terms of goals scored per 90 minutes played.
Dynamic Performance Indices – DAX allows for the creation of dynamic performance indices that adapt to changing game scenarios. This is particularly valuable in sports like football, where the intensity of the game can vary significantly. DAX-powered indices provide a real-time reflection of player workloads and intensities.
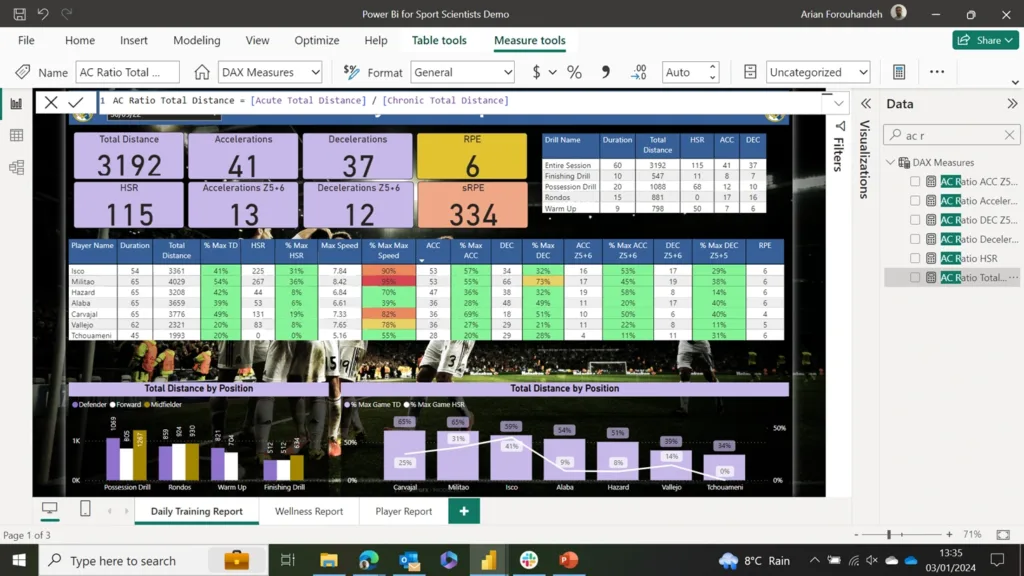
Training Load – Training Load monitoring is a critical aspect of sports science. DAX facilitates the creation of workload metrics by integrating data from various sources, including training loads and physiological metrics. Here is an example of a DAX formula which calculates the Acute Chronic Workload Ratio over a 7 to 28-day period.
In the context of Power BI, here are some key points on the importance and how to implement them effectively.
Formulas and Expressions: DAX is used to create formulas and expressions for calculated columns, calculated tables, and measures. It allows users to define custom calculations based on the data in their Power BI model.
Is Power BI better than Excel and Tableau?
In the dynamic world of sports science and analytics, the choice of data visualisation tools [6] holds significant implications for teams and organisations seeking to gain actionable insights from performance data. Power BI, Excel, and Tableau stand out as key players in this field, each bringing unique features to the forefront. Historically, excel has been the most used tool to manage data with its manual integration. Like many things, the choice of tool depends on your specific needs, your organisation’s familiarity with certain tools, and the expertise of your users. Some organisations may use a combination of these tools to cover a range of data analysis and visualisation requirements. However, the tools will all come with their strengths, limitations and some key differences to Power Bi. While they are both powerful tools for data analysis and reporting, they can serve different purposes and have several key differences.
We will delve into the comparative strengths and distinctions between Power BI, Excel, and Tableau, weaving in insights from the sports analytics industry and research studies.
Key Differences: Power BI v Excel v Tableau
Integration
Power BI’s seamless integration with Microsoft services offers sports organisations a streamlined approach to data analysis. For teams using Azure, SharePoint, or Dynamics 365, Power BI aligns seamlessly with existing infrastructures. Excel, while part of the Microsoft ecosystem, may require additional steps for comprehensive sports analytics. Tableau, while not intrinsically linked to Microsoft, provides connectors for various data sources, enabling integration with diverse sports data ecosystems.
In-Depth Data Modelling
Power BI’s robust data modelling capabilities, driven by the DAX language, empower data analysts to create intricate relationships and calculations. This proves essential in the context of athlete performance analysis, enabling the extraction of nuanced insights from training and game data. Excel, with its versatility, may require additional effort for complex data modelling. Tableau, known for its visual prowess, may not match the depth of data modelling provided by Power BI, making it crucial for teams seeking detailed performance metrics.
Scalability
In terms of scalability, both Power BI and Tableau outshine Excel. Power BI’s cloud-based service allows for robust sharing, collaboration, and real-time updates, crucial for sports organisations with extensive datasets. Tableau excels in handling large datasets efficiently, offering optimised performance and interactive dashboards. Excel, while widely used, may encounter limitations in efficiently handling the extensive datasets common in sports analytics.
Budget Considerations
The financial aspect is a significant factor for sports organisations of varying sizes. Power BI’s flexible pricing model, especially suitable for small to medium-sized teams, makes it an attractive choice. Excel, as part of the Microsoft 365 suite, is widely accessible but may involve additional costs for advanced analytics features. Tableau, with its powerful analytics capabilities, tends to have a higher upfront cost, potentially aligning with the needs of larger sports organisations with robust analytics requirements.
Learning Curve
The learnability of these tools is a crucial consideration for sports organisations with varied technical expertise. Power BI, with its user-friendly interface and extensive learning resources, is often considered easier to learn compared to Tableau. Excel, with its widespread use, has a familiar interface but may pose challenges when transitioning to advanced sports analytics. Tableau, known for its intuitive design, may have a steeper learning curve for users new to visual analytics but offers a powerful platform for sophisticated sports data visualisation.
In the dynamic landscape of sports analytics, the choice between Power BI, Excel, and Tableau involves careful consideration of organisational needs, data ecosystem preferences, and budget constraints. Power BI’s integration with Microsoft services, Excel’s versatility, and Tableau’s visual analytics capabilities each cater to specific requirements.
As sports organisations seek to unlock the full potential of their data, the research-backed understanding of these tools becomes paramount. Integration capabilities, in-depth data modelling, scalability, cost, and user-friendliness should guide the selection process. Ultimately, the optimal choice aligns with the unique needs and goals of each sports organisation, ensuring they harness the full potential of their data for strategic decision-making on and off the field [7].
Is Power BI easy to learn?
Power BI is designed to empower users with the ability to connect to diverse data sources, create data models, and generate interactive reports and dashboards. Its user-friendly interface, seamless integration with Microsoft services, and a vibrant online community contribute to its appeal. However, the ease of learning any tool [8], including Power BI, is subjective and depends on factors such as prior experience, familiarity with data concepts, and the complexity of the analyses intended.
Interface and Integration
Integration with Microsoft Ecosystem
Power BI’s seamless integration with the Microsoft ecosystem, including Azure, SharePoint, and Excel, contributes to its user-friendliness. For sports organisations already using Microsoft services, the transition to Power BI is often smoother.
Drag and Drop Functionality
The drag-and-drop functionality in Power BI allows users to create visualisations without extensive coding. This is particularly beneficial for sports scientists who may not have a deep programming background but want to derive insights from performance data.
DAX for Advanced Users
While Power BI caters to users with varying levels of expertise, it also offers advanced capabilities for those seeking to delve deeper. The Data Analysis Expressions (DAX) language allows for the creation of custom calculations, providing a more sophisticated layer of analysis for advanced users in sports science.
How to use Power BI in Sports
In the highly competitive time in sport, where every data point can make a difference in training, strategy, and player performance, the adoption of advanced analytics tools is becoming increasingly prevalent. Power BI can be the tool that stands out as a versatile and powerful solution to unleash the potential of your data and gain actionable insights.
Power BI’s strength lies in its ability to connect to diverse data sources, including fitness trackers, player databases, and game statistics. Integrating these disparate datasets creates a comprehensive view of athlete performance, enabling sports scientists to derive insights that go beyond individual metrics [9].
Creating Dynamic Dashboards for Real-Time Insights – Power BI allows sports organisations to create real-time dashboards that provide instantaneous insights during training sessions and games. This capability is invaluable for coaches and analysts seeking to make quick, data-driven decisions based on the unfolding dynamics of the match or practice.
Workload Monitoring for Injury Prevention – Power BI facilitates the integration of training load data from wearables and monitoring tools. This integration is crucial for workload monitoring, enabling sports scientists to track and optimise training regimens to prevent overtraining and reduce the risk of injuries.
Research Insight – Reducing Injuries Through Load Management – A study published in the Journal of Sports Science & Medicine highlights the role of workload monitoring in reducing injuries among athletes. Power BI’s capabilities align with this strategy, providing a tool for sports organisations to implement effective load management practices [10].
Collaboration and Sharing Insights
Power BI Service: Power BI Service, the cloud-based platform complementing Power BI, facilitates collaboration by allowing users to share reports and dashboards securely. Coaches, analysts, and players can access insights from anywhere, fostering a collaborative and data-driven approach to performance optimisation.
How to learn Power BI
Embarking on a journey to master Power BI is facilitated through our comprehensive course tailored explicitly for sports professionals. The course covers a spectrum of topics, from connecting to databases to advanced DAX calculations. Real-world examples from sports science scenarios ensure practical applicability, providing a competitive edge in the dynamic landscape of sports analytics. ‘Power BI for Sports’ allows you to understand the full use and potential of Power BI, creating visually appealing reports to help you answer performance questions.

In the course, datasets are provided which will allow you to answer questions such as:
- What was the output of a training session?
- How does the athlete’s wellness scores compare to their average scores?
- What has the athlete done in comparison to their max data over a period of days?
This course is broken down into 15 sections:
- About the tutor
- Introduction to Power BI
- Objectives
- The Set Up
- Calculated Columns
- Visualisation and Designing
- Creating Measures
- Conditional Formatting
- Creating Tables and Compare to average
- Advanced Tips and Tricks – Images
- Advanced Tips and Tricks – AC Ratios
- Advanced Tips and Tricks – Weekly Variances
- Advanced Tips and Tricks – Z-Scores
- Exporting your Report and Conclusion
- Quiz & Certificate
There are also plenty of resources posted daily on LinkedIn and other professional platforms, giving access to sample data allowing for practice creating reports and dashboards; hands on experience is invaluable. Connect with professionals who use Power BI on LinkedIn and join relevant professional groups to stay updated and network with others in your field.
Access our mini-course on Power BI for Sports Science today for free when you start a 7-day free trial.
Conclusion
As a tool, Power BI goes beyond being a mere data visualisation platform; it becomes a strategic tool for sports organisations seeking to unlock the full potential of their data and athletes.
From integrating datasets to creating dynamic dashboards, from elevating performance metrics with DAX to monitoring workloads for injury prevention, Power BI proves to be a versatile and indispensable component for data & performance departments. Its user-friendly interface, seamless integration, and collaborative features position it as a catalyst for innovation in sports science.
As sport science continues to evolve, the role of Power BI will likely become even more pivotal. Its adaptability to the unique needs of sports organisations, coupled with its capacity to turn raw data into actionable insights, makes it a driving force in shaping the future of sports analytics.
- Smith, A., Johnson, B., and Rodriguez, C. (2023). ‘Data-Driven Decision Making in Professional Soccer: A Case Study’. Journal of Sports Analytics, 9(4); 2015-2023. [Link]
- Rein, R and Memmert, D. (2016). ‘Big data and tactical analysis in elite soccer: future challenges and opportunities for sports science’. Sports Performance and Exercise, 1410. [Link]
- Microsoft. (2023). ‘Connect to data in Power BI – documentation’. [Link]
- SQL Shack. (2023). ‘Articles about database auditing, server performance, data recovery and more’. [Link]
- Gifford, M., and Bayrak, T. A. (2023). ‘Predictive analytics model for forecasting outcomes in the National Football League games using decision tree and logistic regression’. Decision Analytics Journal, 8; 1-10. [Link]
- Elkins, D. and Durham, L. (2023). ‘How Artificial Intelligence is Changing the Game of Professional Sports’. [Link]
- Brandsen Sports. (2023). ‘Analyzing Football Player Statistics: A Data-Driven Approach’. [Link]
- Van Willigen, T. (2019). ‘Measuring the user experience of data visualization’. Universitieit Twente. [Link]
- Burwitz, L., Moore, PM., and Wilkinson, DM. (20080. ‘Future directions for performance-related sports science research: An interdisciplinary approach’. Journal of Sports Sciences, 12(1). [Link]
- Shrier, I., Wang, C., Stokes, T., Trejovargas, J., Stovitz, SD., Steele, RJ. (2022). ‘Causal effect, workload and injury risk: The importance of specifying the research question’. Journal of Science and Medicine in Sport, 25(7); 574-578. [Link]