Contents
- Summary
- What does wearable technology measure?
- What metrics are important with wearable technology?
- Real-Time vs. Post-Game Analysis
- Are there any issues with using wearable technology?
- Conclusion
- References
- About the Author
Summary
Given the reliability issues with wearable devices, these issues are inherently passed onto the metrics used to quantify athlete workloads. In other words, the metrics used to monitor athletic performance are innately affected by the limited reliability of the wearable micro-sensors.
Therefore, understanding all of the information within this two-part review is essential when using wearable technology and attempting to interpret the data. Though there are logical concerns regarding the use of wearable technology, they do however possess great potential in the future of athletic monitoring. For example, whilst there are a number of concerns regarding “metabolic power”, the potential use of this metric, if accurate, could be monumental.
What does wearable technology measure?
Following on from the article ‘Part 1: Technology, Validity, and Reliability’ and understanding the technology and its limitations, we can begin to discuss and dismantle some of the metrics that are commonly monitored (e.g. total distance, relative distance, and impacts). If you are about to read this article and have not yet read Part 1, then we highly advise you do.
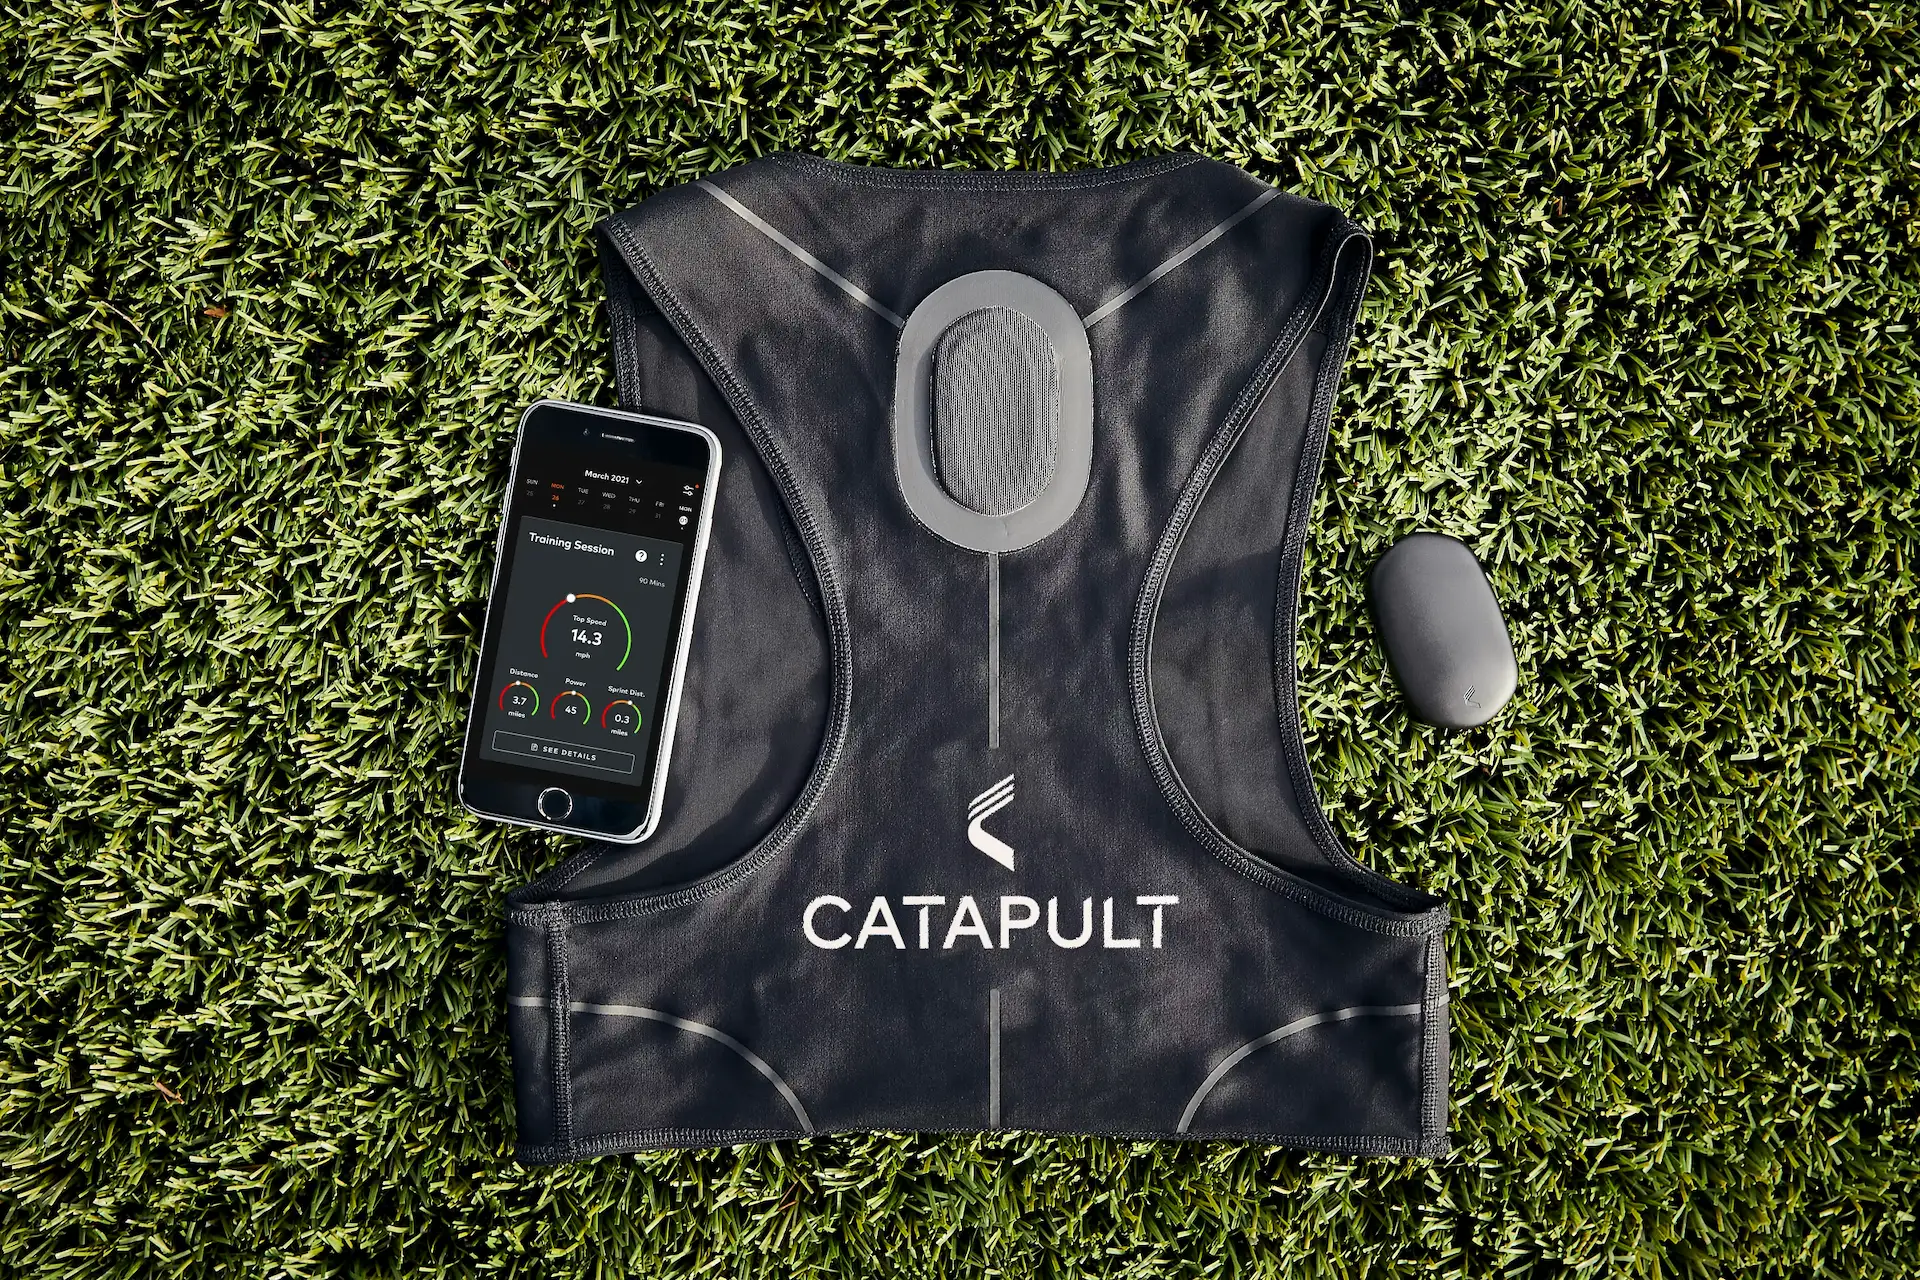
In recent years, the use of wearable technology in professional sports has become common practice and is supplementing the physical development department’s ability to monitor athletic performance and readiness. In most circumstances, sports scientists monitor the following metrics and produce reports on a daily and/or weekly basis:
Primary Metrics (i.e. most common)
- Total distance
- Relative distance
- Number and distance of high-speed runs and sprints
- Number of accelerations and decelerations
- Player/Body load
- Impacts and collisions
- Number of jumps
- Work-rate patterns
- Heart rate exertion (note: this will not be covered in this review)
Secondary Metrics
- Metabolic power
- Fatigue index
- Dynamic stress load
- High-metabolic power distance
Though this is a large list of metrics, sports scientists will often only monitor the ones they deem most important, useful, or reliable. Furthermore, whilst some of the primary metrics have been studied in terms of their validity and reliability, most of the secondary metrics lack any form of scientific investigation. As a result, whilst monitoring these metrics provides the sport scientist with a detailed report of their athlete(s) workload, the usefulness and practicality of this information remain questionable.
What metrics are important with wearable technology?
This section will now discuss some of the metrics frequently used by sports scientists. For the record, it has been reported that distance covered at various speeds and the occurrence of high-speed runs, accelerations, and decelerations are the most commonly monitored metrics (1, 2). Before continuing, it is important to remember the information provided in this article only provides a brief summary of the current research, and is not to be interpreted as a peer-reviewed meta-analysis or systematic review – though it does comprehensively address issues we have personally never before seen discussed.
Total distance (km)
One of the first and most common metrics to be measured, total distance measures the “volume” of work completed by the athlete in kilometres (km).
To date (27/01/17), though no study has directly attempted to measure total distance over an entire competitive match against a gold-standard model, the ability of GPS units to measure total distance at various intensities during movements of ≤ 771 m has been measured (3-5). Across these studies, the authors have reported a coefficient of variance of < 7%, suggesting GPS provides moderate reliability for monitoring total distance. It is also important to note that these studies used 1 and 5 Hz GPS units meaning the accuracy of this data may be improved when using 10 and 15 Hz models.
As total distances vary tremendously depending upon the sport, the position of the athlete in team sports, match tactics, and various other reasons, we feel it would provide little worth to discuss total distances completed in various sports.
Relative distance (m·min-1)
Relative distance is simply the average distance an athlete travels per minute during training or competition. Whilst total distance provides a clear picture of the athlete’s volume of work, relative distance displays the “intensity” of this workload. For example, a Premier League footballer may travel a total distance 13km in any given 90-minute (min) match, meaning they would achieve a relative distance of 144 metres per minute (m·min-1), respectively.
Whilst this metric “paints another picture” in terms of an athlete’s average work rate, this value can also be problematic. For example, during a typical 90-minute football match, Player 1 may spend 45 minutes at 12 kilometres per hour (km·h-1), and another 45 minutes a 2km·h-1. Although hypothetical, this would equate to a total distance of 10.5km, and thus a relative distance of 116 m·min-1. On the other hand, Player 2 may spend 45 minutes at 10km·h-1, and the other 45 minutes at 4km·h-1. This would mean that Player 2 has also travelled a total distance of 10.5km, and has a relative distance of 116 m·min-1.
Though the total and relative distances are the same, both athletes achieved these distances in a completely different manner – highlighting an inherent issue with this metric. It is important the sports scientist understands this issue if they are to monitor relative distance, as this variation in work-rate pattern may significantly alter the athletes’ level of fatigue.
Number and distance of high-speed runs and sprints
This is often used to determine the amount of “high-intensity” efforts the athlete has performed during a training session or match. This metric is typically classified and reported using a ‘work-rate zone’ similar to that displayed in Table 1.
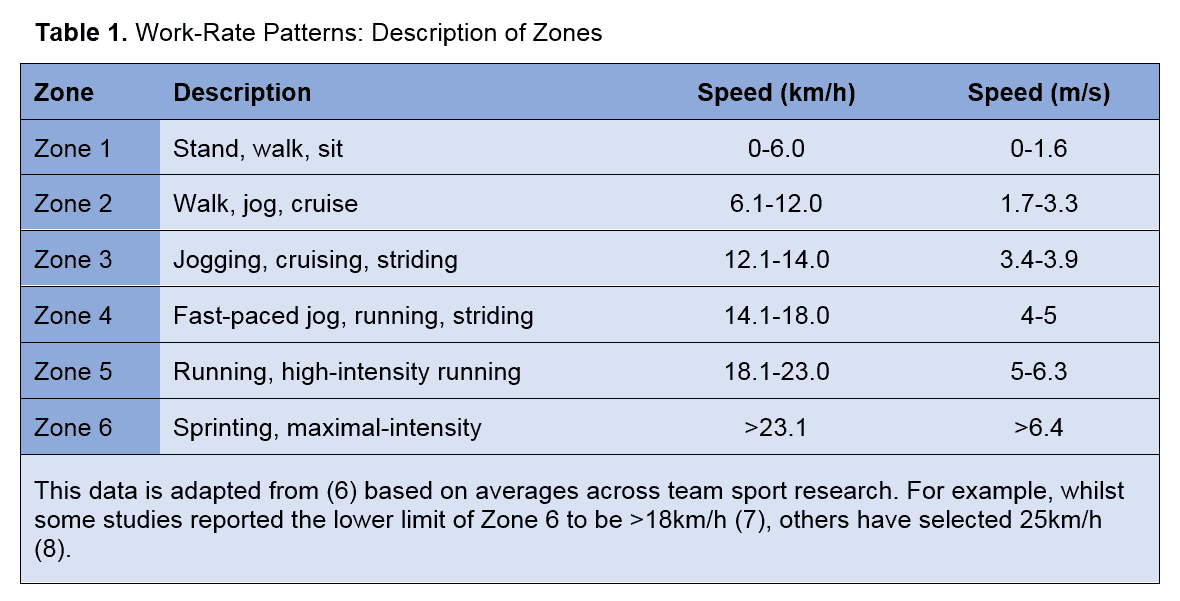
Given these speed classifications, sports scientists will then typically determine the total distance and/or time an athlete spent in Zone 6 for example. In other words, they may report that Player 1 performed a total of five Zone 6 efforts, totalling a distance of 80m, during any given training session or match. It is believed that classifying work-rate patterns in this way overcomes the issue of simply measuring relative distance, as it provides the sports scientist with a clearer interpretation of locomotive work rate.
However, there appears to be growing concern regarding this approach as several sports scientists are beginning to question who has devised these arbitrary work-rate zones, and why have they selected these particular speeds – which is a very interesting and valid point.
Firstly, to put these speeds into context we have devised Table 2 based on 30-40m split times of common team sports. Though the reliability of using a 30-40m split time to predict maximal velocity is questionable, particularly across various sports, it is sufficient for the point being made.

A quick view of the data highlights the first issue of an arbitrary zone classification system, that being, the speed of football players may differ significantly from rugby players – suggesting zone classification should perhaps be sport-specific. Following this point, it is also been shown rugby league backs are faster than forwards (12). This also suggests these speed zones should not only be sport-specific but perhaps even position-specific in order to improve the accuracy of the data collection.
Across the research, there are large variations in the range of speeds for each zone, both within and across sports (6). For example, three studies have selected > 18km/h (5 m/s) to classify Zone 6 (sprinting) in football (13-15). Based upon the maximal velocity data presented in Table 2 – measured using international football players – this would suggest anything above 50 % of maximal velocity (5 m/s) is therefore classified as “sprinting”.
At present, the common question as to why some researchers select certain zone speeds compared to others within the same sport remains unclear. This is obviously very problematic as sports scientists need to individualise their zone speeds based on their own athletes, but without clear justification for thresholds, this is very hard to do. It is therefore recommended these thresholds are individualised by basing them on each player’s maximal velocity (m/s). However, accurately measuring an athlete’s maximal velocity is also difficult, as higher sampling rates (i.e. more measures per second) should be taken during testing other than just extrapolating information from multiple timing gates (i.e. every 10m).
As an additional point, and without going into too much detail, it is important the sports scientist conducts a detailed needs analysis and thus understands the typical physical activity profiles of their athletes during competition. For example, match research on high-level footballers has shown that players perform on average 18 high-speed runs/sprints at > 7.0 m/s (16) per game, and with sprint efforts rarely exceeding distances of 20m and lasting more than four seconds (17). Analysing the available research can help the sports scientist understand this vital information and help them make decisions with regards to training prescription.
Number of accelerations and decelerations
Accelerations and decelerations are simply used as another measure of “high-intensity” exertions (6). An athlete’s ability to accelerate and decelerate in sport is likely to be a critical component to their success (18). Given the extremely high energetic demand of accelerating (19), combined with the disruptive effects on tissue from decelerating (20), it is no surprise that these qualities are likely to be reduced during a match as a result of fatigue (21) – thus potentially reducing the athlete’s chances of success. Knowing this, sports scientists will often measure the number of accelerations and decelerations their athletes perform in training or in a match.
In Australian football, the number of accelerations between the finals and the regular season matches has been shown to almost double (22). Furthermore, as footballers and Australian footballers have been shown to perform six times the amount of maximal accelerations in comparison to high-speed runs/sprints during a game (23), there is growing interest in the importance of these metrics.
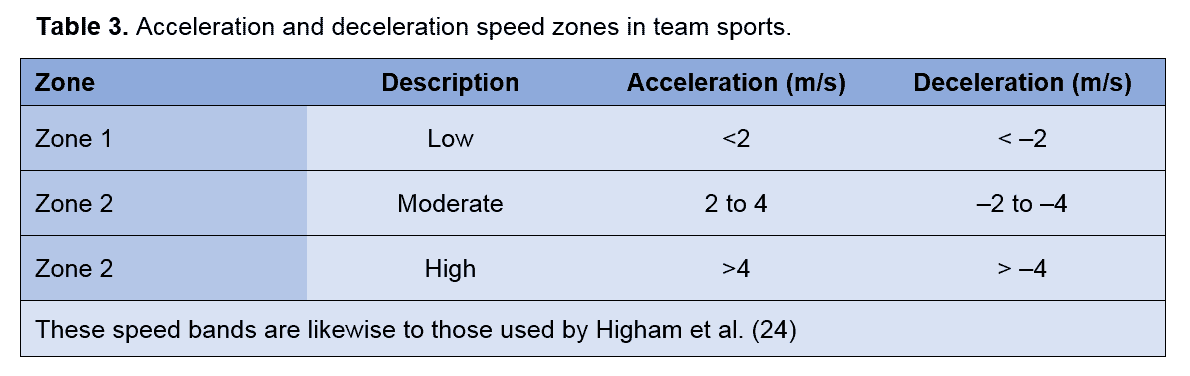
Similarly to the work-rate patterns, accelerations and declarations have also been categorised based on the speed of the movement, which is thought to represent the “intensity” of the action. Table 3 provides an example of how these have typically been categorised within the research. Likewise, to the issues with the work-rate zone classification system, these bands have been devised using arbitrary speeds. This subjects them to the same issues, for example, these acceleration zones should not only be sport-specific but also player-specific.
There are a couple of other deeper lying issues with making these zones player-specific. These are:
- The accuracy of the GPS units is reduced during short-distance, high-speed efforts.
- Maximal acceleration and deceleration speeds need to be accurately analysed during testing.
The poor accuracy of GPS units to measure short-distance, high-speed movements such as accelerations and decelerations is well-documented (1, 2, 6). To add to this problem, using different GPS units, and updating system software have also been shown to substantially affect acceleration and deceleration measures (1). As a result, using GPS units to measure an athlete’s maximal acceleration and deceleration abilities may not provide very reliable results.
On the other hand, typical timing gate arrangements may also not be very effective due to the minimal sample rates (i.e. one sample every 1-2 seconds, or every 5, 10, 20m). This suggests other methods such as increased timing gate samples, high-speed cameras, or laser guns may be required to accurately measure an athlete’s maximal acceleration and deceleration abilities.
Recall from Part 1 (technology, validity, and reliability), that in an attempt to improve the accuracy of the GPS units during short-distance, high-speed movements, the manufacturers have developed a “15 Hz” unit by supplementing the 10 Hz GPS sampling rate with the accelerometer data (25, 2). Surprisingly, whilst the authors did not measure accelerations and decelerations, they did report that the 15 Hz model was less reliable at measuring total distance than the 10 Hz counterpart (25). This therefore severely questions the supplementation of accelerometer data with GPS in an attempt to improve the reliability of the device during short-distance, high-speed movements.
To conclude, it is highly advised sports scientists obtain accurate maximal acceleration and deceleration scores for each player and tailor these speed zones accordingly. In addition, sports scientists are strongly advised to apply care when measuring and comparing data between GPS units and after software updates (1).
Player/Body Load
This metric has been referred to as an ‘‘arbitrary measure of the total external mechanical stress as a result of accelerations, decelerations, changes of direction and impacts’’ (26). Put quite simply, it is the sum of all acceleration forces obtained from the accelerometer data. Many of the concerns regarding this metric were discussed in ‘Part 1’ of this two-part review on wearable technology in sports. However, the primary concern is:
- The unclear inclusion of gyroscope data in quantifying the Player/Body Load forces.
- If gyroscope data is used to compute the Player/Body Load value, then what is the validity and reliability of the algorithm?
Though the use of a wearable unit containing an accelerometer, gyroscope, and magnetometer has been shown to produce reliable results when measuring fast bowlers in cricket, the reliability of this device was reduced during the competition (27). Moreover, whilst these devices have shown sufficient reliability in cricket fast-bowlers, it may be unsuitable to accept that they can also reliably identify “workloads” in team sports. However, it must be said that there is growing research supporting the validity and reliability of these micro-sensors. And despite the concerns regarding the validity and reliability of this metric, many sports scientists use this value to monitor training and match data.
Impacts and Collisions
The importance of this metric is perhaps most critical in sports that contain high-intensity collisions, or blunt force traumas, such as rugby, Australian football, and American football. The intensity of these collisions is measured in G-forces and is typically categorised into the zones displayed in Table 4.
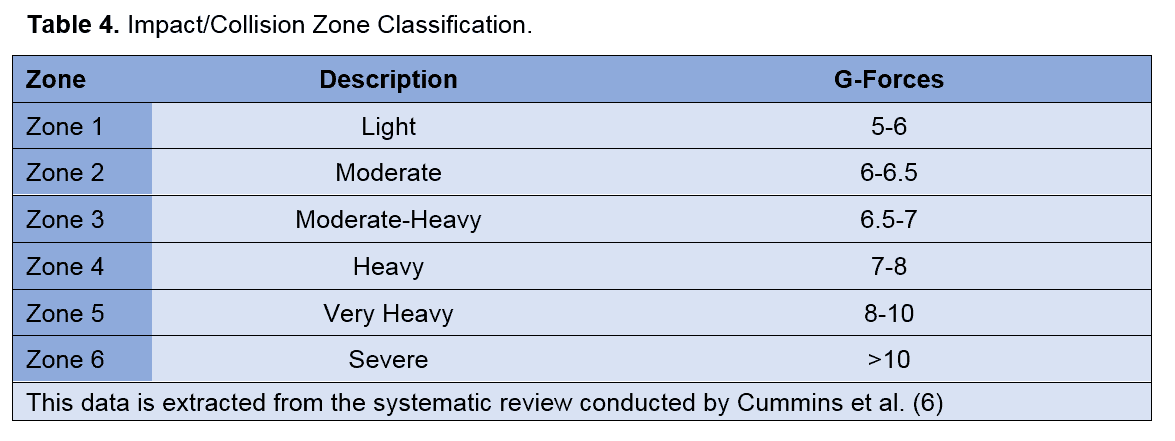
Similarly to the work-rate pattern zones, these are arbitrary thresholds that have not been clearly defined within the research, or by the manufacturers. Again, due to individual physical profiles, it may be suggested these zones should also be individualised, as some athletes may be capable of tolerating larger impact forces – both in magnitude and in volume.
Interestingly, research has shown relationships between skeletal muscle damage using biochemical and endocrine markers and the number, intensity, and distribution of impacts in elite rugby players (28). More specifically, the authors found a relationship between post-match plasma creatine kinase and salivary cortisol concentrations, and the number, intensity, and distribution of impacts sustained by the players during match play. Consistent with other research, the authors only mentioned the data extracted from the tri-axial accelerometer and again failed to discuss any inclusion of gyroscope data. In fact, the authors even mention how they calculated the sum of impact forces…
“the integrated accelerometer measures the rate of acceleration and deceleration on each plane and divides the value by 9.8 m·s-1 to determine the combined G-force as the sum of the G-force measured on each directional axis.” (28).
Regardless of any rotational force data, this relationship suggests that the wearable units may be capable of measuring the degree of external stress rugby players experience during competition. As a result, this study still provides valuable information and may guide future research and clinical practice.
In a similar study (29), the authors also attempted to quantify the frequency, velocity, and acceleration of impacts in Australian football using the same formula used in rugby league research (30). It was reported that out of the 1578 “tackles” recorded by the accelerometer, only a mere 18 % were correctly identified as tackles, while the other 82 % were identified incorrectly (31, 32). It has been suggested that perhaps this large misinterpretation of tackling events is primarily due to the authors using an algorithm that was originally developed for rugby league (30).
Though not enough information is currently known on this topic, if true, it suggests that algorithms must be developed specifically for each sport. Thus severe caution should be taken if you are attempting to use the algorithm developed for rugby league in another sport.
Number of Jumps
When the wearable units were first introduced, they did not include the accelerometer and gyroscope, meaning that only the locomotive demands of sports could be analysed using the GPS micro-sensor. In recent years, the inclusion of these additional micro-sensors has allowed further quantification of skill- and contact-based activities (e.g. jumping, kicking, marking, and tackling). To our knowledge, though no research has validated the use of accelerometers to measure the number of jumps in team sports, they have been validated in ski jumping (32, 33) and in laboratory environments (34). Consequently, the wearable units appear to be a reliable measure of jumping activities
However, it is worth noting that during the ski jumping assessment, two units were worn: one on the sacrum, and the other on the thigh. It is also very important to understand that both of these environments are not as chaotic as other sports (e.g. football, rugby, and Australian football). More chaotic environments, which include other activities such as blocking and tackling, may produce more ”noise” within the data. More noise may lead to the jumping activities being masked or missed, thus decreasing the reliability of the data. As a result, future research should aim to compare the number of jumps derived from wearable units, with video-based technology in an attempt to highlight its reliability in more frantic environments.
Metabolic Power
This is certainly one of the more complicated metrics, and one that has not yet been discussed in this two-part review. Although still in its infancy, the metabolic power metric does express exciting qualities for future application. To simply describe the objective of this metric, its aim is to provide an overall ‘estimate’ of total internal energy expenditure during a performance. Simply meaning, that if accurate, this metric would enable sports scientists to non-invasively measure the energy expenditure of each athlete during training or competition. As a result, whilst its potential could be revolutionising, there are still a number of issues surrounding it.
Metabolic power is measured in Watts per kilogram (W·kg-1) and has been referred to as a “shortcut” to define the amount of energy required, per unit of time, to perform the desired activity (35). In other words, metabolic power is a measure of the amount of adenosine triphosphate (ATP) per unit of time necessary to perform the specific task (35, 36). In a traditional sense, metabolic power is an estimate of energy expenditure and is typically measured using a “gold-standard” protocol such as indirect calorimetry. Indirect calorimetry measures gas exchange (i.e. oxygen consumption and carbon dioxide production) and is often done in a laboratory, previously using a Douglas bag and more recently using a metabolic cart. However, as this is impractical in clinical environments, alternative and more practical solutions have been developed (37, 38).
Professor di Prampero and colleagues have developed an indirect method of calculating metabolic power by measuring running speed and acceleration (37, 38). Put simply, this method attempts to estimate the energy cost of running. And although simplified, they basically measure running speed and the inclination of the body during acceleration to calculate this estimate of energy expenditure.
The metabolic power can be calculated by combining the energy cost of constant running speed with the energy cost of accelerating. The inclination of the body (i.e. the forward lean) is used to determine whether the athlete is accelerating or at constant speed, as athletes typically lean forward more during accelerating in order to place their centre of mass outside of their base of support. The gyroscope in wearable technology is used to identify the inclination of the body during locomotion, whilst the GPS unit is used to identify the movement velocity of the athlete. Thus, the body inclination and movement velocity can be combined to estimate the energy expenditure of the athlete during running.
Whilst this method of estimating energy expenditure via running speed and the inclination of the body has been shown to be reliable during straight-line running (38), there are a number of concerns regarding the true validity and reliability of this method during sport-specific tasks. The following list provides some of the key concerns with this measure of metabolic power:
- It assumes each athlete’s running economy is the same.
- It assumes that deceleration movements have similar energy costs as forward running when the inclination of the body is equivalent.
- It assumes that lateral acceleration energy requirements are equal to linear running energy costs.
- It does not account for change of direction speed energy requirements.
To add to this problem, when using the GPS unit to calculate metabolic power, it also assumes that the wearable device is accurate for measuring the athlete’s speed and distance of locomotion – which in Part 1 of this review was shown to be highly questionable. Therefore, layering a potentially unreliable metabolic power estimation on top of a small-moderately reliable measurement device (i.e. GPS), it should be recommended that significant caution is taken when interpreting this metric. There are also several other issues surrounding this metric which are unfortunately beyond the scope of this article.
If you wish to learn more about this metric then please read the two following articles:
- di Prampero PE, Botter A, Osgnach C. The energy cost of sprint running and the role of metabolic power in setting top performances. Eur J Appl Physiol (2015) 115:451–469. [PubMed]
- Buchheit M, Manouvrier C, Cassirame J, Morin JB. Monitoring Locomotor Load in Soccer: Is Metabolic Power, Powerful? Int J Sports Med 2015; 36: 1149–1155 [PubMed]
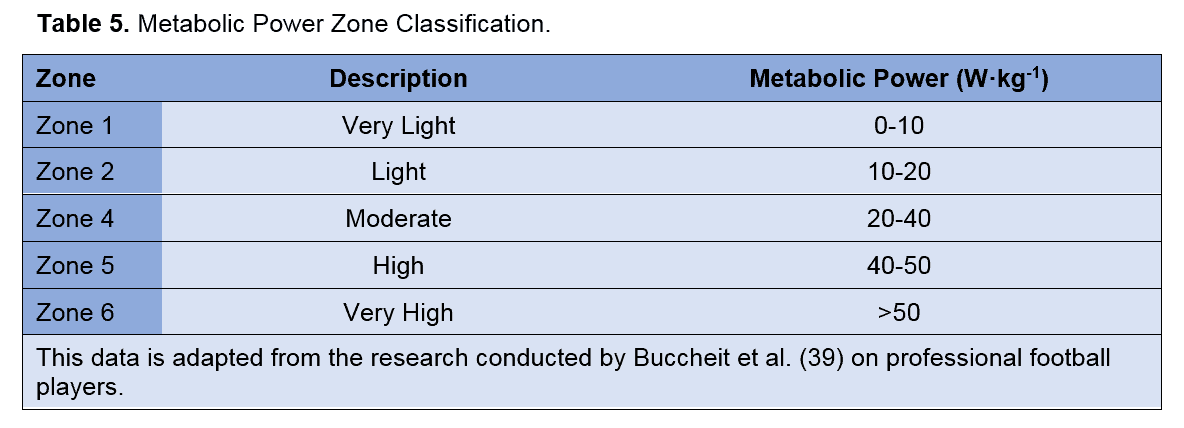
In addition to the above information, we also felt it may be beneficial to provide you with ‘arbitrary’ metabolic power zone classifications (Table 5) which have been adapted from research on professional football players (39). However, it is important to understand these zones have been constructed using arbitrary zones and based on a specific population.
Real-Time vs. Post-Game Analysis
In recent years, coaches have also opted to monitor athletic performance in real-time, though very little research has attempted to validate this method. To our knowledge, only two studies have investigated the reliability of real-time analysis (8, 40), with only one being published (8). Both studies reported that real-time analysis is relatively inaccurate and underestimates locomotive workload. Having said that, it is still important to consider the fact that some GPS units are more reliable than others, and thus those used within both these studies may be different to the ones you may be currently using.
Although not directly related to the quality of the wearable devices, these errors often play a trivial but frustrating part in any sport scientist’s attempt to collect high-quality data.
- Failure to input, or lack of correct athlete information on the system’s computer programme.
- Failing to adequately charge the units prior to usage.
- Switching units on approximately five minutes prior to usage in the area (e.g. field) about to be used.
- Having units ‘ready-to-go’ for athletes and informing them not to tamper with the units to prevent confusion with their readiness.
- Collecting all units and downloading data promptly after use.
Although somewhat trivial, these issues often play a big part in day-to-day data collection. It is, therefore, highly recommended the practitioner establishes a general usage plan for the technology in order to ensure consistency with data collection.
Are there any issues with using wearable technology?
There are several things to be aware of if using wearable technology:
- GPS units appear to be reliable for measuring total distance but struggle during short-distance, high-velocity movements such as accelerations, decelerations, and changes in direction.
- Supplementing GPS data with accelerometer data may in fact reduce the reliability of the device.
- The relative distance metric can be misleading, and not “paint the whole picture” when it comes to work-rate patterns.
- The zone classification systems appear to be based on arbitrary figures and should not only be sport-specific but also position- and player-specific.
- The Player/Body Load, impacts, and collision metrics may all underestimate the total external load as the algorithm used to quantify these does not include gyroscope data.
- The algorithms used in one sport (e.g. the “impacts” algorithm in rugby league) appear to be specific to that particular sport, and thus unreliable when used in others.
- Whilst wearable devices have been shown to be reliable at measuring jumps in somewhat non-chaotic environments, they may not be as reliable in chaotic sports such as football and rugby.
- Though the metabolic power metric may be revolutionising, there are still too many concerns regarding both its validity and reliability.
- The real-time analysis appears not to be as reliable as post-game data.
Conclusion
The reliability issues associated with the micro-sensors are inherently passed onto the metrics, thus raising concern with the variables used to monitor athletic performance. To add to this problem, sports scientists are often monitoring a large assortment of metrics in an attempt to find trends and improve the accuracy of monitoring. Combined, it may be suggested that this method is more problematic than effective. In other words, trying to monitor too many unreliable metrics is potentially more problematic.
As a result, it may be suggested that data analysts spend some time researching, discussing, and identifying which metrics they firstly deem most reliable, and secondly deem most appropriate for monitoring purposes. Doing so should theoretically provide the team with more accurate and useable data.
- Buchheit M, Al Haddad H, Simpson BM, Palazzi D, Bourdon PC, Di Salvo V, and Mendez-Villanueva A. Monitoring Accelerations With GPS in Football: Time to Slow Down? International Journal of Sports Physiology and Performance, 2014, 9, 442 -445. [PubMed]
- Aughey RJ. Applications of GPS technologies to field sports. Int J Sports Physiol Perform. 2011;6:295–310. [PubMed]
- Coutts AJ, and Duffield R. Validity and reliability of GPS devices for measuring movement demands of team sports. Journal of Science and Medicine in Sport 13 (2010) 133–135 [PubMed]
- Gray AJ, Jenkins D, Andrews MH, Taaffe DR, Glover ML. Validity and reliability of GPS for measuring distance travelled in field-based team sports. Journal of Sports Sciences, October 2010; 28(12): 1319–1325 [PubMed]
- Jennings D, Cormack S, Coutts A, Boyd L and Aughey R. The validity and reliability of GPS units for measuring distance in team sport specific running patterns. Int J Sport Phys and Perf. 2010;5:328-341 [PubMed]
- Cummins C, Orr R, O’Connor H, et al. Global positioning systems (GPS) and microtechnology sensors in team sports: a systematic review. Sports Med. 2013;43(10):1025–42 [PubMed]
- Wisbey B, Montgomery PG, Pyne DB, et al. Quantifying demands of AFL football using GPS tracking. J Sci Med Sport. 2010;13(5):531–6. [PubMed]
- Aughey RJ, Falloon C. Real-time versus post game GPS data in team sports. J Sci Med Sport. 2010;13(3):348–9. [PubMed]
- Wisløff U, Castagna C, Helgerud J Jones R, Hoff J. Strong correlation of maximal squat strength with sprint performance and vertical jump height in elite soccer players. Br J Sports Med 2004;38:285–288 [Link]
- Barr MJ, Sheppard JM, Gabbett T, Newton RU. The Effect of Ball Carrying on the Sprinting Speed of International Rugby Union Players. International Journal of Sports Science & Coaching Volume 10 · Number 1 · 2015. [PubMed]
- Stein JG, Gabbetta TJ, Townshenda AJ, Dawson BT. Physical qualities and activity profiles of sub-elite and recreationalAustralian football players. Journal of Science and Medicine in Sport. [PubMed]
- de Lacey, J, Brughelli, ME, McGuigan, MR, and Hansen, KT. Strength, Speed and power characteristics of elite rugby league players. J Strength Cond Res 28(8): 2372–2375, 2014 [PubMed]
- Castagna C, Impellizzeri F, Cecchini E, et al. Effects of intermittent- endurance fitness on match performance in young male soccer players. J Strength Cond Res. 2009;23(7):1954–9. [PubMed]
- Barbero Alvarez J, Lopez M, Barbero Alvarez V, et al. Heart rate and activity profile for young female soccer players. J Hum Sport Exerc. 2008;3(2):1–11. [Link]
- Casamichana D, Castellano J. Heart rate and motion analysis by GPS in beach soccer. J Sports Sci Med. 2010;9:98–103. [PubMed]
- Quanz, G., Der Einfluss Einer Intermittierend Kohlenhydratzufuhr auf die Leistungs-fähigkeit in Einem Fusballspiel – Eine Simulationsstudie, Insider, 1999, 7, 7-12.
- Di Salvo, V., Baron, R., Tschan, H., Calderon Montero, F.J., Bachl, N. and Pigozzi, F., Performance Characteristics According to Playing Position in Elite Soccer, International Journal of Sports Medicine, 2007, 28(3), 222–227. [PubMed]
- Dintiman G and Ward B. Starting and Stopping. In: Sports Speed (3rd ed). Champaign, IL: Human Kinetics, 2003. pp. 213–217. [Link]
- Osgnach C, Poser S, Bernardini R, Rinaldo R, di Prampero PE. Energy cost and metabolic power in elite soccer: a new match analysis approach. Med Sei Sports Exerc. 2010:42(l):170-178. [PubMed]
- Hewit J, Cronin J, Button C, Hume P. (2011). Understanding deceleration in sport. Strength and conditioning journal. 2011; 33(1):47-52. [Link]
- Aughey RJ. Australian football player work rate: evidence of fatigue and pacing? Int J Sports Physiol Perform. 2010;5(3);394-05. [PubMed]
- Aughey RJ. Increased high intensity activity in elite Australian football finals matches. Int J Sports Physiol Perfonn. 2011 ;6:367-379. [PubMed]
- Varley MC, Aughey RJ, Pedrana A. Accelerations in football: Toward a better understanding of high-intensity activity. In: Proceedings of Vllth Worl Congress on Science and Football, Nagoya, Japan: Japanese Soeiety of Science and Football; 2011:343. [Link]
- Higham DG, Pyne DB, Anson JM, Eddy A. Movement patterns in rugby sevens: Effects of tournament level, fatigue and substitute players. Journal of Science and Medicine in Sport Volume 15, Issue 3, May 2012, Pages 277–282. [PubMed]
- Johnston, RJ, Watsford, ML, Kelly, SJ, Pine, MJ, and Spurrs, RW. Validity and interunit reliability of 10 Hz and 15 Hz GPS units for assessing athlete movement demands. J Strength Cond Res 28(6): 1649–1655, 2014 [PubMed]
- Weaving D, Marshall P, Earle K, et al. A combination of internal and external training load measures explains the greatest proportion of variance in certain training modes in professional rugby league. Int J Sports Physiol Perform. 2014;9:905–12. [PubMed]
- McNamara D, Gabbett T, Chapman P, et al. The validity of microsensors to automatically detect bowling events and counts in cricket fast bowlers. Int J Sports Physiol Perform. 2015;10:71–5. [PubMed]
- McLellan, CP, Lovell, DI, and Gass, GC. Biochemical and endocrine responses to impact and collision during elite rugby league match play. J Strength Cond Res 25(6): 1553–1562, 2011 [PubMed]
- Gastin P, Breed R, McLean O, et al. Quantification of tackling demands in elite Australian football using integrated wearable athlete technology. J Sci Med Sport. 2013;16(6):281. [PubMed]
- Gabbett T, Jenkins D, Abernethy B. Physical collisions and injury during professional rugby league skills training. J Sci Med Sport. 2010;13(6):578–83. [PubMed]
- Gastin P, Mclean O, Breed R, et al. Tackle and impact detection in elite Australian football using wearable microsensor technology. J Sports Sci. 2014;32(10):947–53. [PubMed]
- Chardonnens J, Favre J, Le Callennec B, et al. Automatic measurement of key ski jumping phases and temporal events with a wearable system. J Sport Sci. 2012;30(1):53–61. [PubMed]
- Chardonnens J, Favre J, Cuendet F, et al. Characterization of lower-limbs inter-segment coordination during the take-off extension in ski jumping. Hum Mov Sci. 2013;32(4):741–52. [PubMed]
- Choukou M, Laffaye G, Taiar R. Reliability and validity of an accelerometric system for assessing vertical jumping performance. Biol Sport. 2014;31(1):55–62. [PubMed]
- The calculation of Metabolic Power with Professor Di Prampero | Dr Andy Franklyn-Miller Sports Medicine | Podcast Chart. 2016. The calculation of Metabolic Power with Professor Di Prampero | Dr Andy Franklyn-Miller Sports Medicine | Podcast Chart. [ONLINE] Available at: [Link] [Accessed 02 April 2016].
- Is the Metabolic Power really understood? – GPEXE. 2016. Is the Metabolic Power really understood? – GPEXE. [ONLINE] Available at: [Link] [Accessed 24 March 2016].
- di Prampero PE, Fusi S, Sepulcri L, Morin JB, Belli A, Antonutto G. Sprint running: a new energetic approach. J Exp Biol 2005; 208: 2809–2816 [PubMed]
- di Prampero PE, Botter A, Osgnach C. The energy cost of sprint running and the role of metabolic power in setting top performances. Eur J Appl Physiol (2015) 115:451–469. [PubMed]
- Buchheit M, Manouvrier C, Cassirame J, Morin JB. Monitoring Locomotor Load in Soccer: Is Metabolic Power, Powerful? Int J Sports Med 2015; 36: 1149–1155. [PubMed]
- Dallaway, N. (unpublished). Movement profile monitoring in professional football. University of Birmingham Research Archive. 2013. [Link]