Contents of Article
- Summary
- What is the 20m Sprint Test?
- Who would benefit from the 20m Sprint Test?
- How do you conduct the 20m Sprint Test?
- How is the 20m Sprint Test scored?
- What are the considerations for using the 20m Sprint Test?
- Is the 20m Sprint Test valid and reliable?
- References
- About the Author
Summary
Though the 20m Sprint Test is commonly used to measure acceleration in both track and team sport athletes, there are currently uncertainties as to what this test actually measures. As track athletes continue to accelerate beyond 50m, then it can be suggested with a level of confidence that the 20m sprint test does measure acceleration in these athletes. However, the same may or may not apply to team sports athletes.
Both handheld stopwatches and electronic timing gates have been proven to be reliable assessment devices. As the distance from the start line, starting position, and the height of the timing gates have all been shown to affect the test results, it is advised these are all mandated and kept consistent to avoid testing error.

What is the 20m Sprint Test?
Speed tests are typically used solely to measure an athlete’s linear speed capabilities. Track sprinters have been shown to accelerate continuously through at least 50m during a 100m sprint event (1, 2, 3). On the other hand, the average sprint distance in team sport athletes has been reported to be between 15-21 m (4, 5, 6) and rarely last more than three seconds (7, 8, 9). As a result, because team sport athletes perform shorter distance sprints compared to track athletes, it has been suggested they may achieve maximum speeds within far shorter distances – perhaps as short as ≤ 21m.
However, though little research has been conducted on this topic, the current evidence has demonstrated that team sport athletes and physical education students achieved maximum speeds around 40m when performed from a static standing start (10, 11) and 29m from a flying start (10). Thus it can be speculated the 20m sprint does measure acceleration in team sport athletes. Nonetheless, this difference means there are implications with regard to what the 20m Sprint Test measures depending on the athlete being tested. For example, the 20m Sprint Test may only measure acceleration in track athletes, whereas it might display maximum speed in some team sport athletes – especially when performed from a rolling- or flying start. The test administrators must, therefore, consider their athletes before interpreting the results.
Before the introduction of timing gates, speed tests were typically officiated using stopwatches. While stopwatches are still useful and can be used as a reliable measure, the use of timing gates is highly recommended and essential when a high degree of precision is required (12, 13).
Who would benefit from the 20m Sprint Test?
As the average sprint distance in team sport athletes (e.g. football and rugby) appears to be between 15-21m (4, 5, 6), then conducting the 20m sprint test may be a useful tool to determine the performance of such athletes. As track athletes have been shown to still be accelerating through distances of approximately 50m (1, 2, 3), then the 20m sprint test may be a useful marker purely of their ability to accelerate.
How do you conduct the 20m Sprint Test?
It is important to understand that whenever fitness testing is performed, it must be done so in a consistent environment (e.g. facility) so it is protected from varying weather types, and with a dependable surface that is not affected by wet or slippery conditions. If the environment is not consistent, the reliability of repeated tests at later dates can be substantially hindered and result in worthless data.
Required Equipment
Before the start of the test, it is important to ensure you have the following items:
- Reliable and consistent testing facility of at least 35m in length (e.g. indoor hall or artificial sports field).
- Test administrators (minimum of two).
- Timing gates x 2 (preferred, but not essential)
- Measuring tape (≥ 20 m)
- Stopwatch
- Marker cones
- Performance recording sheet
Test Configuration
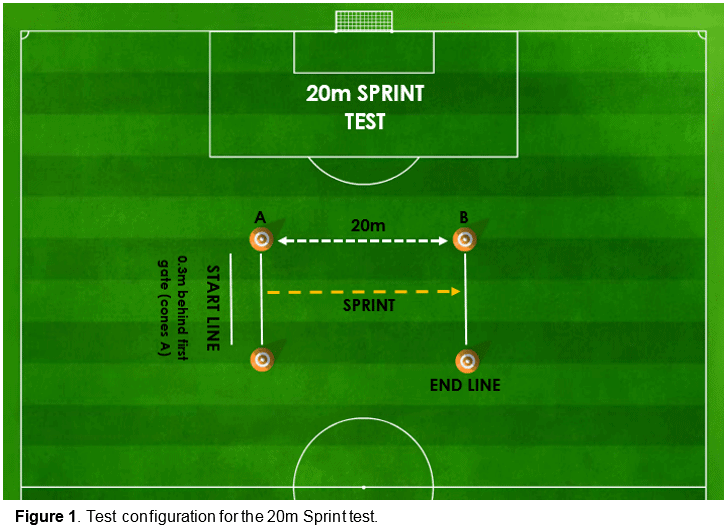
Figure 1 displays the test configuration for the 20m sprint test. This setup must be adhered to if accurate and reliable data is desired.

Important information for using timing gates
The distance between the start-line and the first timing gate (cones A – Figure 1) has been shown to affect short-distance sprint times (14). Put simply, the greater the distance, the faster the sprint time as it allows the athlete to generate more speed before crossing the first timing gate. As the 10m sprint is a measure of acceleration, it is recommended the start-line is positioned 0.3m behind the first timing gate in accordance with Altmann et al. (2015) (14).
The height of the timing gates has also been proven to significantly affect the performance results (15). When testing, it is therefore imperative that a standardised, consistent protocol is used to reduce variances within the data. For example, it may be suggested that the gates are always set at a consistent height of 1m.
Test Procedure
Warm-up
- Participants should thoroughly warm-up prior to the commencement of the test. Warm-ups should correspond to the biomechanical and physiological nature of the test. In addition, sufficient recovery (e.g. 3-5 minutes) should be administered following the warm-up and prior to the commencement of the test.
Starting the test
- Participant readies themselves on the start-line (positioned 0.3m behind the first gates – cones A) in a standing split-stance start position. NOTE: it is important for reliability that the participant always uses the same starting stance.
- Participant should be counted down ‘3 – 2 – 1 – GO ‘.
- If the test administrators are using a stopwatch, then the timekeeper must stand at the finish line and perform the countdown and time the sprint.
- On the ‘GO’ signal the participant must accelerate maximally to the finish line as quickly as possible.
- Each participant MUST complete a MINIMUM OF THREE SPRINTS, each separated by a 2-3 minute rest if reliable results are desired.
After the test
- Once the test is over, some subjects may react to the previous exertion. To reduce any problems, the subjects should rest, either sitting or standing, for at least 2-3 minutes. If the subject feels ill or goes quiet or pale, they should lie down with their feet resting on a chair. Note: never leave the participant alone after the test.
How is the 20m Sprint Test scored?
If three sprints were completed, all the scores are normally then generated into a mean score which provides an overall 20m sprint time. This is done by using the following equation:
- Mean score (seconds) = (#1 sprint time + #2 sprint time + #3 sprint time) ÷ total number of sprints (e.g. 3)
What are the considerations for using the 20m Sprint Test?
When conducting the test there are several factors that need to be taken into consideration before you begin – some being:
- Accuracy of the stopwatch – Though hand-held stopwatches have been proven to be reliable when measuring speed, they are not recommended when high degrees of precision are required (12, 13). If timing gates are not available, then it is imperative the test administrators understand the inconsistencies of using a stopwatch for their results. As a result, test administrators must pay great attention and attempt to communicate clearly in order to maximise the accuracy of the results.
- Starting stance – As the starting position can impact performance (16), it is suggested participants always adopt the same starting position. The split stance (one leg forward, and one back) is most recommended.
- Starting distance from first timing gate – As previously discussed, the distance between the start line and the first set of gates significantly affects sprint times. Therefore, it is essential to remain consistent with the set-up configuration. For the 5m Sprint Test, we recommended a distance of 0.3m.
- Height of the timing gates – To the author’s knowledge, only one study to date has assessed the effects of timing gate height on sprint performance (15). The authors measured significant sprint time differences when the gates were set at 60cm and 80cm. However, there is no current research that identifies an optimal height for testing. As a result, it is highly recommended that the test administrators adopted one height (e.g. 1m) and stick to it.
- Circadian rhythms – circadian rhythms have been shown to significantly alter anaerobic performance tests. Current knowledge suggests that early morning anaerobic tests will elicit significantly lower peak power values than late afternoon or evening tests (17).
- Surface and Conditions – Before conducting the test, ensure the surface is non-slip and consistent (e.g. not affected by weather). Secondly, ensure the environment/ facility is also consistent and not affected by weather conditions.
- Individual effort – Sub-maximal efforts can result in inaccurate and meaningless scores.
Is the 20m Sprint Test valid and reliable?
Research has shown that the 20m Sprint Test is a valid and reliable test when conducted with electronic timing gates. The publication also determined that high levels of reliability can be achieved without the need for familiarization sessions (18).
Though the test has been deemed valid and reliable, it is important to understand what it is actually valid for. For instance, the 20m sprint may be valid for measuring acceleration in track athletes, but it may measure maximum speed in team sport athletes. Therefore, the test may be a valid test for one, but not the other. It is therefore vital that the strength and conditioning coach or sport scientist truly understands what aspect of performance they wish to measure (i.e. acceleration or maximum speed). Nonetheless, as long as this principle is well-understood, then the 20m Sprint Test can be both valid and reliable.
- Brown, T. D., & Vescovi, J. D. (2012). Maximum speed: Misconceptions of sprinting. Strength & Conditioning Journal, 34(2), 37-41. [Link]
- Nagahara, R., Matsubayashi, T., Matsuo, A., & Zushi, K. (2014a). Kinematics of transition during human accelerated sprinting. Biology open, BIO20148284. [PubMed]
- Nagahara, R., Naito, H., Morin, J. B., & Zushi, K. (2014b). Association of acceleration with spatiotemporal variables in maximal sprinting. International journal of sports medicine, 35(9), 755-761. [PubMed]
- Andrzejewski, M., Chmura, J., Pluta, B., Strzelczyk, R., & Kasprzak, A. (2013). Analysis of sprinting activities of professional soccer players. The Journal of Strength & Conditioning Research, 27(8), 2134-2140. [PubMed]
- Andrzejewski, M., Chmura, J., Pluta, B., & Konarski, J. M. (2015). Sprinting Activities and Distance Covered by Top Level Europa League Soccer Players. International Journal of Sports Science and Coaching, 10(1), 39-50 [Link]
- Gabbett, T. J. (2012). Sprinting patterns of national rugby league competition. The Journal of Strength & Conditioning Research, 26(1), 121-130. [PubMed]
- Docherty D, Wenger HA, Neary P. Time-motion analysis related to the physiological demands of rugby. J Hum Mov Stud. 1988;14:269–277.
- Deutsch MU, Maw GJ, Jenkins D, Reaburn P. Heart rate, blood lactate and kinematic data of elite colts (under-19) rugby union players during competition. J Sports Sci. 1998;16:561–570. [PubMed]
- Spencer M, Lawrence S, Rechichi C, Bishop D, Dawson B, Goodman C. Time-motion analysis of elite field hockey, with special reference to repeated-sprint activity. J Sports Sci. 2004;22:843–850. [PubMed]
- Benton D. An analysis of sprint running patterns in Australian Rules football: the effect of different starting velocities on the velocity profile. Unpublished Honours thesis 2000; University of Ballarat.
- Berthoin S, Dupont G, Pierre M. Predicting sprint kinematic parameters from anaerobic field tests in physical education students. J Strength Cond Res. 2001;15(1):75–80. [PubMed]
- Hetzler, RK, Stickley, CD, Lundquist, KM, and Kimura, IF. Reliability and accuracy of handheld stopwatches compared with electronic timing in measuring sprint performance. J Strength Cond Res 22(6): 1969–1976, 2008 [PubMed]
- Mayhew, JL, Houser, JJ, Briney, BB, Williams, TB, Piper, FC, and Brechue, WF. Comparison between hand and electronic timing of 40-yd dash performance in college football players. J Strength Cond Res 24(2): 447–451, 2010 [PubMed]
- Altmann, S, Hoffmann, M, Kurz, G, Neumann, R, Woll, A, and Haertel, S. Different starting distances affect 5-m sprint times. J Strength Cond Res 29(8): 2361–2366, 2015 [PubMed]
- Cronin, J.B., & Templeton, R.L. (2008). Timing light height affects sprint times. Journal of Strength and Conditioning Research, 22(1), 318-320. [PubMed]
- Cronin, J.B., J.P. Green, G.T, Levin, M.E. Brughelli, and D.M. Frost. Effect of starting stance on initial spring performance. Strength Cond. Res. 21(3):990–992. 2007. [PubMed]
- Teo, W., Newton, M.J., & McGuigan, M.R. (2011). Circadian rhythms in exercise performance: Implications for hormonal and muscular adaptation. Journal of Sports Science and Medicine, 10, 600-606. [PubMed]
- Moir, G., C. Button, M. Glaister, and M.H. Stone. Influence of familiarization on the reliability of vertical jump and acceleration sprinting performance in physically active men. J. Strength Cond. Res. 18(2):276–280. 2004. [PubMed]


