Contents of Article
- Summary
- Why is load monitoring important in sports?
- What is the acute:chronic workload ratio?
- What are the acute:chronic workload ratio models?
- How can you calculate acute:chronic workload ratio?
- Why is the acute:chronic workload ratio important for performance?
- Are there any issues with the acute:chronic workload ratio?
- Is future research into acute:chronic workload ratio needed?
- Conclusion
- References
- About the Author
Summary
Monitoring of training and match loads is imperative to enhance performance and prevent injury. An effective monitoring protocol can provide important feedback to assist in the planning and periodisation of training, optimise physical condition, and avoid injury.
One such method that can provide this important ‘snapshot’ is the acute:chronic workload ratio. The acute:chronic workload ratio (ACWR) is comprised of an athlete’s ‘fitness’ and ‘fatigue’, and can be calculated using either the rolling average (RA) model or the exponentially weighted moving average (EWMA) model.
The actual value presented by the acute: chronic workload ratio has different implications, and can assist practitioners in understanding the preparedness of an athlete, the relative injury risk of an athlete from day to day, and therefore, with carefully planned intervention, can help to prevent injury.
Why is load monitoring important in sports?
Sport is evolving continuously and has taken great strides over the past few decades, from games played principally for enjoyment, to a competitive professional industry (1). Athletes participating in elite sports are exposed to increasingly higher training loads, saturated competition calendars, and very short periods of rest and recovery (2). In a study conducted by Bengtsson et al. (2013) (3), match congestion was associated with increased injury rates. Further studies have also shown that higher injury rates have a major effect on a team’s overall performance and final log standings (4, 5). As such, reducing the amount of time lost through injury is extremely important.
Given the importance of player availability and overall team performance, there has been a surge in training load and monitoring research in recent years (6). Evidence from this research suggests that poor training load management and prescription is a major risk factor for injury (2). In fact, it is commonly viewed that training load-related injuries are, for the most part, preventable, and thus, sports science and sports medicine practitioners should address these issues by implementing monitoring protocols (7). These monitoring protocols need to address the issues of training load management and prescription to improve performance, track readiness, and most importantly, to prevent injury.
One such protocol/ method of training load monitoring which has gained popularity over the last decade due to its versatility is the ‘acute: chronic workload ratio’. This ratio allows practitioners to view a snapshot of an athlete’s training and match-load history, thus, allowing practitioners to gauge their athletes’ readiness to compete, improve training periodisation, and act as a flagging value for injury risk.
What is the acute:chronic workload ratio?
The acute:chronic workload ratio (ACWR) is the ratio between how much workload has been done in the last 7 days (acute workload) versus the average weekly workload that has been performed over the previous 28 days (chronic workload). In other words, it is how much workload has been performed in the last week compared to the previous month.
The ACWR ratio is calculated by dividing the acute workload (fatigue) by the chronic workload (fitness). For example, if an athlete ran 30km in the past 7 days (acute workload) and in the previous 4 weeks (28 days) they ran an average of 28.5km*, then you would simply divide the acute workload (30km) by the chronic workload (28.5km), resulting in an ACWR of 1.05. In other words, the athlete did 105% of the workload in the past week compared to what they did over the past 4 weeks – meaning they had a total workload increase of 5%.
*Week 1 (25km) + Week 2 (30km) + Week 3 (32km) + Week 4 (27km)
4-week average = 28.5km
The chronic workload values can change from 4 weeks, 6 weeks, or 8 weeks, etc., but it is important to understand that you can lose valuable insight if you choose a longer chronic workload value. With an 8-week average, for instance, it’s harder to see weekly changes compared to a 4-week average.
History of the ACWR
In 1975, Banister et al. (8) proposed “the performance of an athlete in response to training can be estimated from the difference between a negative function (‘fatigue’) and a positive function (‘fitness’).” Building on Banister’s model, it was later suggested the ideal training stimulus is one that maximises performance by utilising an appropriate training load, whilst simultaneously limiting the negative consequences of training (i.e. injury and fatigue) (9).
Therefore, it is important for practitioners to understand and monitor training load so that they can gauge their athlete’s past and present fitness levels. Or, in other words, what they have previously done and are prepared for. The relationship between what they have done, and what they are prepared for, can be examined via the use of the ACWR.
Acute Workload
Typically, this is the workload performed by an athlete in one week (seven days) (10). This value contains both training- and match-load information over this seven-day period. It is this figure which is represented as the ‘fatigue’ aspect of the ACWR.
For example, a common method for calculating workload is by multiplying the session rating of perceived exertion (sRPE) by session duration. Thus, if an athlete reported an sRPE of 6 and trained for 100 minutes, the athlete’s workload for the day would be 600 arbitrary units (AU) (6 * 100 = 600). If the athlete trained twice in one day (e.g. a technical session and a gym session), then the workload for both of these sessions would be added together to calculate the acute workload for that given day (e.g. 600 + 800 = 1400 AU).
This process would need to be replicated for each athlete and for every training and match day. The final ‘acute workload’ value and interpretation of the data will vary according to the type of ACWR model the practitioner wishes to use (e.g. The Rolling Average Model or the Exponentially Weight Moving Average Model).
Chronic Workload
The chronic workload is typically the four-week (28-day) average acute workload (10). This value is important as it provides a clear indication of what an athlete has done leading up to the present training or match day. Therefore, it is commonly viewed as an indication of an athlete’s ‘fitness’.
For example, let’s suggest an athlete had a weekly average (acute) workload consisting of the following:
- Week 1 = 1400 AU
- Week 2 = 1200 AU
- Week 3 = 1800 AU
- Week 4 = 1600 AU
In this case, the four-week chronic workload value would be the average of these four workloads (1400 + 1200 + 1800 + 1600 / 4 = 1500 AU). This is a simple example of what the four-week chronic workload represents, but it is important to understand that a three-week (21-day) chronic workload value is also commonly used (11).
Similarly, to the acute workload, the exact calculation of the chronic workload, and its dynamic day-to-day value, will depend on the type of ACWR model that is being utilised by the practitioner (e.g. the Rolling Average Model or the Exponentially Weight Moving Average Model).
Acute: Chronic Workload Ratio
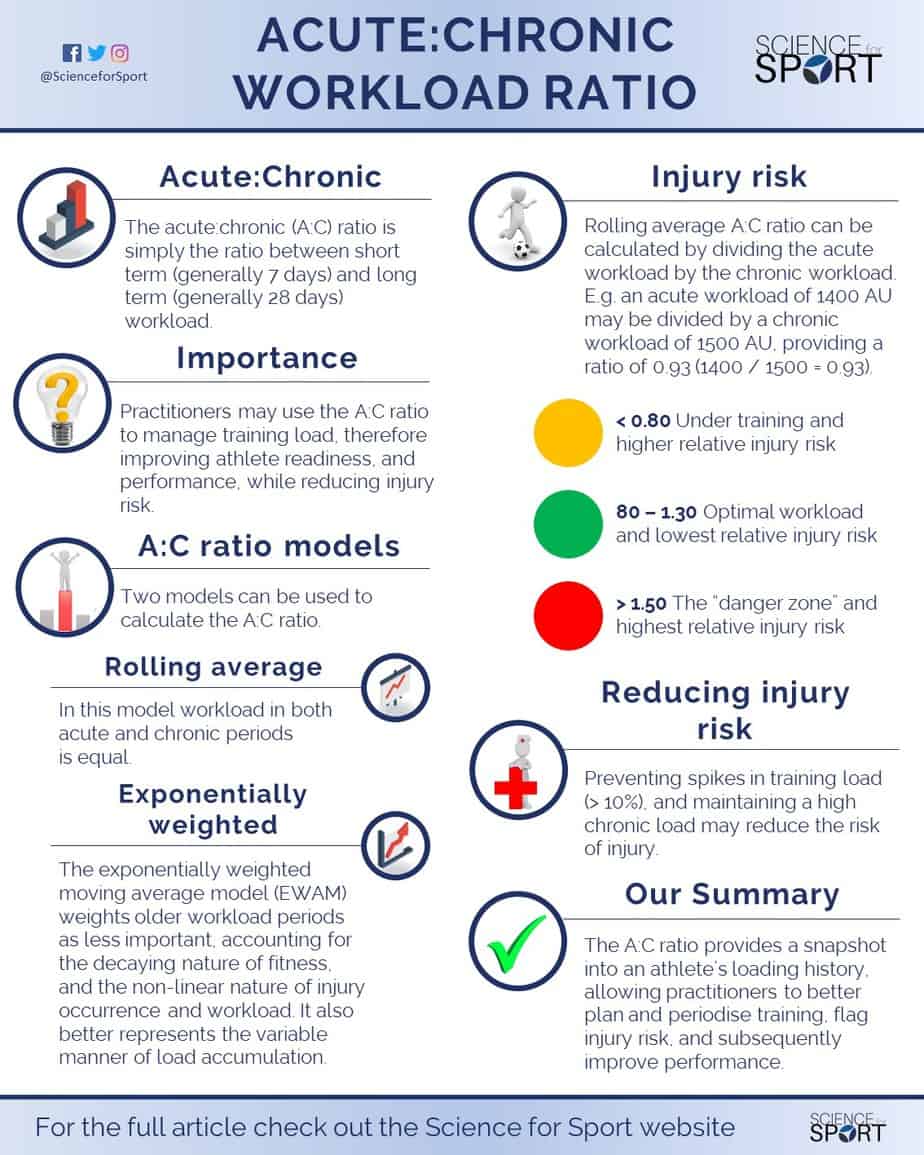
The ratio itself is calculated by dividing the acute workload (fatigue) by the chronic workload (fitness). For example, an acute workload of 1400 AU may be divided by a chronic workload of 1500 AU, providing an ACWR of 0.93 (1400 / 1500 = 0.93).
Generally, in team sports such as soccer, which has regular fixtures (Saturday to Saturday), the acute workload is the training load performed by an athlete in one week, and the chronic workload is the four-week average acute workload (as stated above) (10). Having said this, it is important to note these periods can be altered according to the calendar associated with that sport.
For example, this relationship was recently investigated in AFL, and it was found that a 3:21 day ratio best described non-contact injury occurrence (11). However, the investigators concluded by stating that “the best choices of acute and chronic time windows may need to be identified sport by sport, or team by team, and it may depend on the specific structure of an athlete’s competition and training schedule.” Thus, further research is required for this aspect of the ACWR.
Comparison of the acute workload to the chronic workload as a ratio, is, therefore, a dynamic representation of a player’s preparedness (12). This ratio allows practitioners to consider the training load the athlete has performed recently (within the last training week) relative to the training load the athlete has prepared for (within the last four weeks).
What are the acute:chronic workload ratio models?
There are two main models for calculating the ACWR, these are:
- The Rolling Average (RA) Model
- The Exponentially Weighted Moving Average (EWMA) Model
The main difference between these two models is the weighting that is assigned to each training day’s training-load data.
The Rolling Average (RA) Model
The RA model uses absolute (i.e. total) workload performed in one week (acute workload) relative to the four-week chronic workload (i.e. four-week average acute workload). This model suggests that each workload in an acute and chronic period is equal. Thus, the RA model considers the relationship between load and injury as linear, and therefore, all workload in a given time period is seen as equivalent.
This model does not account for any decay in fitness, nor does it accurately represent variations in the manner in which loads are accumulated. A potential solution to these limitations of the RA model potentially lies with the EWMA model (13, 14).
The Exponentially Weighted Moving Average (EWMA) Model
The EWMA model places a greater emphasis on the most recent workload an athlete has performed by assigning a decreasing weighting for each older workload value (15). This model was specifically designed to account for the decaying nature of fitness, and the non-linear nature of injury occurrence and workload (16). Additionally, it better represents variations in the manner in which loads are accumulated (14).
The relationship between the RA model and the EWMA model is depicted below in Figure 1.
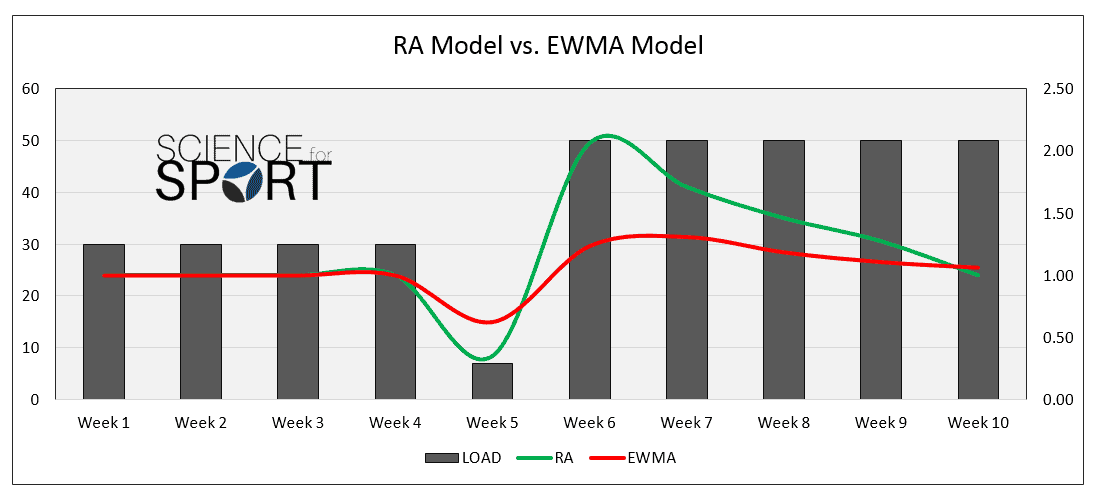
To clarify the difference between the RA and EMWA models, Figure 1 depicts the ACWR over a 10-week period. Despite similar workloads over the first four weeks, there is an obvious difference in the ACWR during week 5.
According to the RA model, if an athlete were to cover 30 km a week for four weeks (chronic load of 30km) and were to then get injured, or fall ill, during week 5 after only having covered 7 km, then their acute training-load would simply be 7 km. This would mean their ACWR would be 0.23 (ACWR: 7 / 30 = 0.23).
However, because the EWMA model places greater emphasis on the most recent workload and accounts for the decaying nature of fitness (rather than a steep drop off in fitness, as depicted by the RA model) it would calculate the same athlete’s ACWR to be 0.62 in week 5. The EWMA model does this by applying an exponentially weighted formula to calculate the acute load and the chronic load, thus producing a more realistic ACWR value.
This is, therefore, a more accurate snapshot into the athlete’s preparedness as the EWMA model takes into account the built-up chronic load (i.e. fitness) and the decaying nature of the athlete’s fitness (i.e. it does not simply disappear after only one week, as portrayed by the RA model).
Thereafter, if the athlete resumed training the following week, they would exhibit an elevated ratio indicating an increased risk of injury. This increased relative risk may be true, however, as stated above the decaying nature of fitness and fatigue effects over time need to be better accounted for. This decaying nature is, therefore, better represented by the EWMA model (as seen in red in Figure 1) and produces the most accurate and injury-sensitive ACWR (15).
The ACWR is typically calculated using one of the two main models (RA and the EWMA), as discussed above. These models were investigated by Murray et al. (2016) (15), and for both models, a high ACWR was significantly associated with an increase in injury risk.
The EWMA model has been shown to have greater sensitivity to detect increases in injury likelihood in comparison to the RA model (15). The EWMA model is also more sensitive to day-to-day changes in workload and will allow practitioners to better detect where an athlete sits on the ACWR spectrum. This, therefore, allows practitioners to prevent athletes from entering into the so-called “danger zone” (7).
Ultimately, the choice will be up to the practitioner as to which model they utilise, but both do show merit. However, the EWMA model better accounts for the decaying nature of fitness, and appears to be more sensitive in detecting injury risk than the MA model. Practically, the EWMA is easier to work with and seems to be more useful in day-to-day athlete monitoring. The model the practitioner decides to use has practical implications, and therefore, requires careful and planned interventions to make the best training-load alterations.
How can you calculate acute:chronic workload ratio?
The ACWR ratio is calculated by dividing the acute workload (fatigue) by the chronic workload (fitness). Sports science and medical practitioners can use the ACWR to monitor and track a variety of different training loads/metrics. Practitioners typically obtain measures of ‘external training load’ (the mechanical load placed on an athlete) in isolation, or in combination with a measure of ‘internal training load’ (the physiological or psychological response to the imposed demands).
External load
External load is the external stimulus applied to the athlete (17). It is the objectively measurable physical work performed during training and/or competition. A common way of measuring external load is using wearable technology. Examples of external load metrics include:
- Total distance
- Number of sprints
- Player/Body Load
- Weight lifted
Internal load
Internal load is the individual physiological and/or psychological response to external loads, combined with daily life stressors and other environmental and biological factors (18). It includes objective measures such as heart rate, as well as subjective measurements such as ratings of perceived exertion (RPE). Examples of internal load metrics include:
- Heart rate
- RPE (e.g. sRPE)
- Creatine kinase measures
- Blood lactate concentrations
It is important for the practitioner to understand that identical external training loads could elicit considerably different internal training loads in two athletes. Meaning the training stimulus (external load prescribed) may be appropriate for one athlete, but inappropriate for another (either too high or too low). Thus, monitoring of training load should be done on an individual basis when possible, and focus on the metrics that will provide the best insight for an individual or a team.
Why is the acute:chronic workload ratio important for performance?
A variety of studies have investigated the ACWR using both external measures (10, 20) and internal measures (12) to calculate the ACWR and have identified extremely useful relationships and trends.
ACWR and Injury Risk
As stated previously, comparing the acute training load to the chronic training load as a ratio provides a ‘snapshot’ of the athlete’s preparedness. If the acute training load is low (i.e. the athlete is experiencing minimal ‘fatigue’) and the chronic training load is high (i.e. the athlete has developed ‘fitness’), then the athlete will be in a well-prepared state (7). In this scenario, the ACWR will be around 1.00 or less. Inversely, if the acute training load is high (i.e. high levels of fatigue) and the chronic training load is low (i.e. low fitness levels), then the athlete will be in a more fatigued state. In this case, the ACWR will exceed 1.00 (7).
Studies have investigated this ratio in a variety of sports, ranging from AFL (19) and Rugby (10) to Soccer (12) and Gaelic Games (21). The majority of these studies have found the same trends and relationships in terms of the ACWR and subsequent injury risk. This is represented in the graph below (Figure 2).
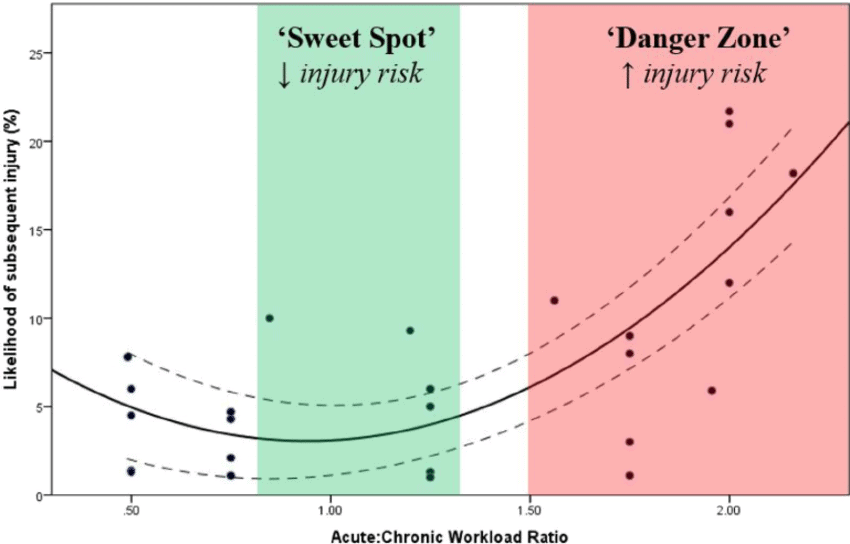
Practically this means that the ACWR can be monitored every day, for each athlete. The actual value of the ratio will have a practical significance, and with careful planning and alteration, it can help to reduce the risk of injury. The ACWR value and its various meanings are listed below:
- < 0.80 (Under-training and higher relative injury risk)
- 80 – 1.30 (Optimal workload and lowest relative injury risk – “The Sweet Spot”) (7).
- > 1.50 (The “danger zone” and highest relative injury risk)
It is important to note these values are not ‘golden’ numbers, and will not apply to every athlete in every sport. An athlete’s prior training history, development, injury record, and level of participation will have a major influence on their training load tolerance and subsequent injury risk. For example, a study conducted by Malone in professional soccer indicated a ‘sweet spot’ of between 1.00 – 1.25 for the lowest relative injury risk (12). This is similar but different, to what was previously shown in rugby league (0.85 – 1.35) (10).
Taking this into account, it is important to conduct some research into your sport in order to determine the injury risk ranges; with the best-case scenario being an in-house study of your athlete population. However, from the start of a new monitoring protocol, given the research that has been done to date and its findings, it will be safe to utilise the above ranges until more individualised, athlete-specific ranges (within your population) present themselves.
Training-Load Spikes and Injury
The process of analysing training load data and calculating ACWR can yield helpful insight into training load progression, particularly as it is a useful tool to view changes in workload over time. Because of this, research has now subsequently investigated this relationship and found that excessive and rapid increases in training load are responsible for a large percentage of non-contact soft-tissue injuries (2, 10, 12, 17).
Thus, it is important to consider how week-to-week changes in training load influence injury risk. In a study on Australian Rules football players, it was reported that 40 % of injuries were associated with a rapid change (> 10 %) in weekly (i.e. acute) training load compared to the previous week (23). Therefore, to minimise the risk of injury, practitioners may wish to limit weekly training load increases to less than 10 %.
High Chronic Loads and Injury Protection
The ACWR can not only be used to monitor athletes from day to day but it can also be used during training load planning and periodisation. Evidence suggests that both physically hard and accumulated physically hard training (appropriately planned), may protect against injuries (10). For example, one study found that athletes with high chronic loads (fitness) had better protection against injuries when exposed to high acute training loads (10).
From a practical standpoint, this means that if practitioners have a good understanding of the load that their athletes are going to experience in competition, they can plan training programmes in order to appropriately prepare them for these events. This, therefore, offers a protective effect against injury, and may theoretically lead to greater physical outputs and resilience in competition, as well as higher levels of athlete availability (i.e. having athletes available for training and competition) (7).
Are there any issues with the acute:chronic workload ratio?
There are a few issues with the ACWR monitoring method and its use in sport. The majority of research points to it being a useful tool; however, there are a few drawbacks and debates.
Accuracy of the Training-Load Metrics
To obtain the most precise ACWR, the data that is used to quantify training load needs to be reliable and accurate. Practitioners should take every step to ensure that the data being collected is as reliable as possible. For example, the validity and reliability of GPS systems should be thoroughly researched beforehand, including the training load metrics desired for use. With the results, only the training metrics which show the best reliability, and are most appropriate, should be used for monitoring purposes.
Additionally, if something like sRPE is being utilised to quantify workload, then it may be worth having your players report these values via a mobile app, or something similar. This will reduce peer pressure and the replication of the ratings voiced by other athletes (12).
These are just two simple examples of accuracy and reliability issues, and a demonstration that any metric that is chosen should be carefully considered to mitigate inaccuracy. Collection methods should also be as organised and as consistent as possible.
The Mountain of Data
The amount of raw data generated by teams can, at times, be overwhelming. In order to quantify both internal and external loads using the ACWR, the practitioner would have to input, manipulate, and report on hundreds of data points, every single day.
Is future research into acute:chronic workload ratio needed?
There is a lot of opportunity to add a layer of very useful research to the existing knowledge base. Some of the desired areas of research include the following:
- Training-load studies concerning youth development and injury risk, particularly during the period of peak height velocity.
- Individual differences in the ability to withstand different ACWR and subsequent injury risk.
- The development of injury-prediction models using the ACWR.
Conclusion
Recording acute and chronic training loads and modelling the ACWR allows practitioners to determine if athletes are in a state of ‘fitness’ (i.e. net training recovery, lower than average risk of injury) or ‘fatigue’ (i.e. net training stress, higher than average risk of injury). Additionally, utilising the ACWR allows practitioners to view a snapshot into an athlete’s training and match-load history, thus, allowing readiness to be gauged more easily, to better plan and periodise training, act as a flagging value for injury risk, and subsequently improve performance.
- Hill, J. and Williams, J., 2010. Introduction.Sport in History, 29(2), pp.127-131
- Soligard, T., Schwellnus, M., Alonso, J., Bahr, R., Clarsen, B., Dijkstra, H., Gabbett, T., Gleeson, M., Hägglund, M., Hutchinson, M., Janse van Rensburg, C., Khan, K., Meeusen, R., Orchard, J., Pluim, B., Raftery, M., Budgett, R. and Engebretsen, L., 2016. How much is too much? (Part 1) International Olympic Committee consensus statement on load in sport and risk of injury.British Journal of Sports Medicine, 50(17), pp.1030-1041. http://bjsm.bmj.com/content/50/17/1030
- Bengtsson, H., Ekstrand, J. and Hägglund, M., 2013. Muscle injury rates in professional football increase with fixture congestion: an 11-year follow-up of the UEFA Champions League injury study.British Journal of Sports Medicine, 47(12), pp.743-747. https://www.ncbi.nlm.nih.gov/pubmed/23851296
- Eirale, C., Tol, J., Farooq, A., Smiley, F. and Chalabi, H., 2012. Low injury rate strongly correlates with team success in Qatari professional football.British Journal of Sports Medicine, 47(12), pp.807-808. http://bjsm.bmj.com/content/47/12/807.short
- Bengtsson, H., Ekstrand, J., Waldén, M. and Hägglund, M., 2013. Match Injury Rates in Professional Soccer Vary with Match Result, Match Venue, and Type of Competition.The American Journal of Sports Medicine, 41(7), pp.1505-1510. http://journals.sagepub.com/doi/abs/10.1177/0363546513486769
- Bourdon, P., Cardinale, M., Murray, A., Gastin, P., Kellmann, M., Varley, M., Gabbett, T., Coutts, A., Burgess, D., Gregson, W. and Cable, N., 2017. Monitoring Athlete Training Loads: Consensus Statement. International Journal of Sports Physiology and Performance, 12, pp. S2-161-S2-170. http://journals.humankinetics.com/doi/abs/10.1123/IJSPP.2017-0208
- Gabbett, T., 2016. The training—injury prevention paradox: should athletes be training smarter and harder?.British Journal of Sports Medicine, 50(5), pp.273-280. http://bjsm.bmj.com/content/early/2016/01/12/bjsports-2015-095788?__hstc=196135283.0bb2ae1552d2dda845881b6516c33848.1481673600081.1481673600082.1481673600083.1&__hssc=196135283.1.1481673600084&__hsfp=528229161
- Banister, E., Calvert, T., Savage, M., 1975. A systems model of training for athletic performance.Aust J Sports Med, 7, pp.57-61. https://www.researchgate.net/publication/224112604_A_Systems_Model_of_the_Effects_of_Training_on_Physical_Performance
- Morton, R., 1997. Modelling training and overtraining.Journal of Sports Sciences, 15(3), pp.335-340. http://www.tandfonline.com/doi/abs/10.1080/026404197367344
- Hulin, B., Gabbett, T., Lawson, D., Caputi, P. and Sampson, J., 2015. The acute: chronic workload ratio predicts injury: high chronic workload may decrease injury risk in elite rugby league players.British Journal of Sports Medicine, 50(4), pp.231-236. http://bjsm.bmj.com/content/early/2015/10/28/bjsports-2015-094817.short
- Carey, D., Blanch, P., Ong, K., Crossley, K., Crow, J. and Morris, M., 2016. Training loads and injury risk in Australian football—differing acute: chronic workload ratios influence match injury risk. British Journal of Sports Medicine, 51(16), pp.1215-1220. http://bjsm.bmj.com/content/bjsports/early/2016/10/26/bjsports-2016-096309.full.pdf
- Malone, S., Owen, A., Newton, M., Mendes, B., Collins, K. and Gabbett, T., 2017. The acute: chronic workload ratio in relation to injury risk in professional soccer.Journal of Science and Medicine in Sport, 20(6), pp.561-565. http://www.sciencedirect.com/science/article/pii/S1440244016302304
- Hunter, J., 1986. The exponentially weighted moving average.J Quality Technol, 18(203), p.10. http://orbak.home.uludag.edu.tr/L11-OnEWMA.pdf
- Williams, S., West, S., Cross, M. and Stokes, K., 2016. Better way to determine the acute: chronic workload ratio?British Journal of Sports Medicine, pp. bjsports-2016-096589. http://bjsm.bmj.com/content/51/3/209
- Murray, N., Gabbett, T., Townshend, A. and Blanch, P., 2016. Calculating acute: chronic workload ratios using exponentially weighted moving averages provides a more sensitive indicator of injury likelihood than rolling averages.British Journal of Sports Medicine, 51(9), pp.749-754. http://bjsm.bmj.com/content/51/9/749
- Hawley, J., 2002. Adaptations of Skeletal Muscle to Prolonged, Intense Endurance Training.Clinical and Experimental Pharmacology and Physiology, 29(3), pp.218-222. http://onlinelibrary.wiley.com/doi/10.1046/j.1440-1681.2002.03623.x/full
- Gabbett, T., 2004. Influence of training and match intensity on injuries in rugby league.Journal of Sports Sciences, 22(5), pp.409-417. http://www.tandfonline.com/doi/abs/10.1080/02640410310001641638
- Huxley, D., O’Connor, D. and Healey, P., 2013. An examination of the training profiles and injuries in elite youth track and field athletes.European Journal of Sport Science, 14(2), pp.185-192. http://www.tandfonline.com/doi/abs/10.1080/17461391.2013.809153
- Murray, N., Gabbett, T., Townshend, A., Hulin, B. and McLellan, C., 2016. Individual and combined effects of acute and chronic running loads on injury risk in elite Australian footballers. Scandinavian Journal of Medicine & Science in Sports, 27(9), pp.990-998. http://onlinelibrary.wiley.com/doi/10.1111/sms.12719/full
- Bowen, L., Gross, A., Gimpel, M. and Li, F., 2016. Accumulated workloads and the acute: chronic workload ratio relate to injury risk in elite youth football players. British Journal of Sports Medicine, 51(5), pp.452-459. http://bjsm.bmj.com/content/early/2016/07/22/bjsports-2015-095820.short
- Malone, S., Roe, M., Doran, D., Gabbett, T. and Collins, K., 2017. Protection Against Spikes in Workload with Aerobic Fitness and Playing Experience: The Role of the Acute: Chronic Workload Ratio on Injury Risk in Elite Gaelic Football. International Journal of Sports Physiology and Performance, 12(3), pp.393-401. http://journals.humankinetics.com/doi/abs/10.1123/ijspp.2016-0090
- Piggott, B., Newton, M. J., & McGuigan, M. R., 2009. The relationship between training load and incidence of injury and illness over a pre-season at an Australian football league club. Journal of Australian Strength and Conditioning, 17(3), pp. 4-17. http://researchonline.nd.edu.au/health_article/61/