
Contents
- Introduction
- What do the different tests tell us?
- The strength and plyometric decision tree
- Practical applications
- Conclusion
- References
- About the Author
- Comments

Introduction
Strength and power training are training modalities commonly used by Strength & Conditioning (S&C) coaches, as both qualities underpin the execution of many essential athletic skills in a variety of sports (13). As an S&C coach, many vertical lower-body power tests measure an athlete’s maximum power capabilities.
Tests such as the countermovement jump (CMJ), squat jump (SJ), eccentric utilisation ratio (EUR), drop jump test (DJ) and force-velocity profiling (FVP) all provide us with different insights into an athlete’s maximum vertical lower-body power capabilities.
Yet, a legitimate question for S&C coaches is ‘How should the data from each of these individual tests be used to build an overall picture of an athlete’s lower-body power capabilities, to help guide training program design?’.
Therefore, this article aims to provide a framework model, using a decision tree to outline how S&C coaches might use the tests mentioned above, to gain a holistic insight into an athlete’s maximum vertical lower-body power capabilities.
The article may also help practitioners answer some critical questions regarding the individualization of strength and power training. This is of high importance, as elite athletes with a substantial level of maximal strength and power require more advanced, novel and individualized, specific training for adaptation to occur (2).
What do the different tests tell us?
Countermovement Jump
The CMJ is used to measure lower-body vertical power (9, 10). Athletes go from an eccentric downwards movement to a concentric vertical jump as quickly as possible, using the slow stretch-shortening cycle (SSC). The slow SSC has been defined as having a duration which is >0.25 s (12).
Squat Jump
The SJ is also used to measure vertical lower-body vertical power (9, 10). Athletes start in a static, self-selected quarter position which is held for 3 seconds, with no further downward dipping allowed before jumping. This ensures any elastic energy is dissipated and eliminates the SSC effect on the vertical jump (10), so we can measure an athlete’s lower-body vertical power as a concentric movement only, from a static position, with no SSC involved.
Eccentric Utilisation Ratio
The eccentric utilisation ratio (EUR) is simply the ratio between CMJ and SJ performance and provides insight into an athlete’s slow SSC ability. It has been suggested that an ideal EUR is ~1.1, in which the CMJ score should be 1.1x (10 %) that of the SJ (8). For example, if an athlete scores 45 cm on the CMJ and 39 cm on the SJ, they have a EUR of 1.15 (45 divided by 39).
This suggests that the athlete has an effective slow SSC in comparison to their lower-body vertical power from a static position. As such, power training which consists of no SSC, ballistic exercises, loaded plyometrics and maximum strength work would likely benefit this athlete. Ballistic exercises are defined as the explosive release of the body into the air, but the overall duration of the exercise is longer mainly due to an extended ground contact time, such as an SJ (3).
Incremental Drop Jump Test
The incremental drop jump (DJ) test measures reactive power, through the fast SSC. This has been defined through a ground contact time of <0.25 s (5), which also defines the threshold for fast plyometric exercises Schmidtbleicher (1992) (12). The scores from this test enable S&C coaches to calculate the reactive strength index (RSI), which is an estimate of an athlete’s ability to rapidly go from an eccentric muscular contraction to a concentric muscular contraction (6).
According to Flanagan, the RSI can be used to decide which intensity of plyometric training is most appropriate depending on an athlete’s level (6). An RSI score of 2.0 – 2.5 suggests athletes are ready to perform high-intensity plyometrics (e.g. drop jumps), whereas a score of 1.5 – 2.0 makes moderate-intensity plyometrics (e.g. tuck jumps) and an athlete that scores <1.5 should perform the low intensity or extensive plyometrics (e.g. extensive pogo jumps).
From here on out, plyometrics refers to exercises which are characterized by a fast SSC activity, which is a ‘shock’ component, where a ground contact time (GCT) that is < 0.25s occurs with the floor (12).
Force-Velocity Profiling
Force-velocity profiling (FVP) provides a more detailed picture of an athlete’s specific strength and speed needs, by using a movement such as a barbell jump squat with incremental loads (7). The equation used in the FVP has been validated for estimating an athlete´s different strength capacities and has high reliability (11).
By running an FVP test, S&C Coaches can measure and plot an athlete’s force and velocity across the incremental loads and compare them to ideal values, described as the force-velocity imbalance (7). This test can be conducted with a validated smartphone application that collects reliable FVP data for a low cost (1). Based on the acquired FVP, the S&C coach can see where the biggest potential for adaptation lies, across the athlete´s force-velocity curve (FV-curve).
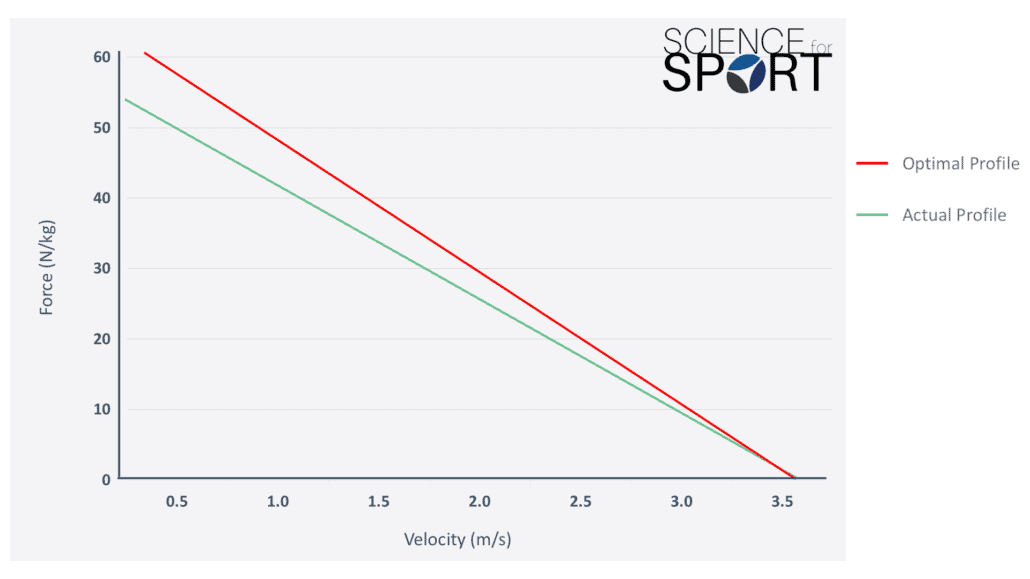
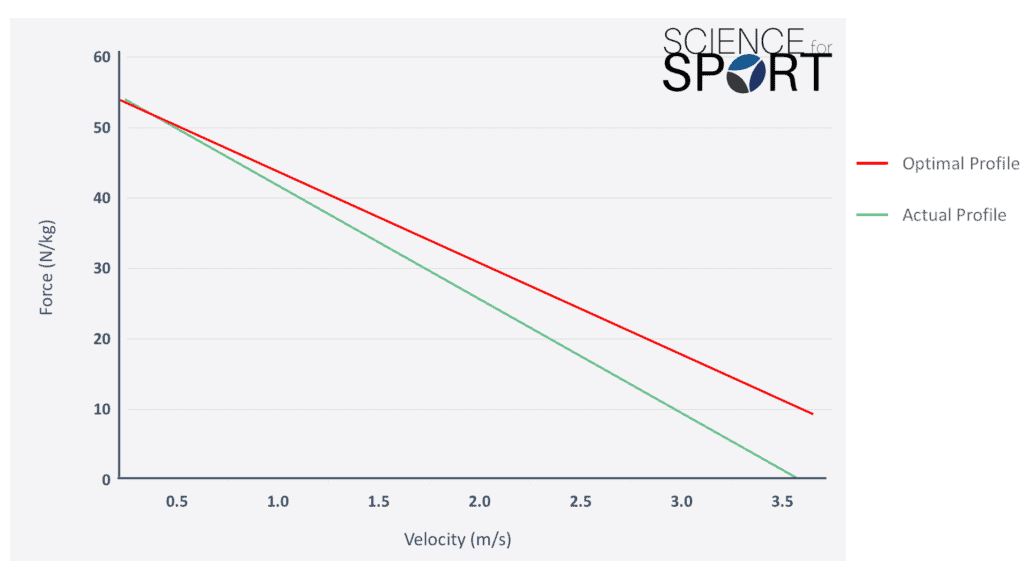
In Figures 1 and 2 an athlete´s optimal force-velocity values (optimal profile) are presented in red, while the actual force-velocity values (actual profile) are presented in green. Figure 1 – Athlete A requires training orientated towards force production (i.e. maximal strength and strength-speed).
This is based on where the deficiency is the biggest, between the optimal and actual values (i.e. the biggest gap between the red and green line). Figure 2 – Athlete B requires training orientated towards velocity (i.e. speed-strength and plyometrics). This is because the deficiency is biggest between the optimal and actual values (i.e. the biggest gap between the red and green line) at high velocity, low force.
The Strength & Plyometric Decision Tree
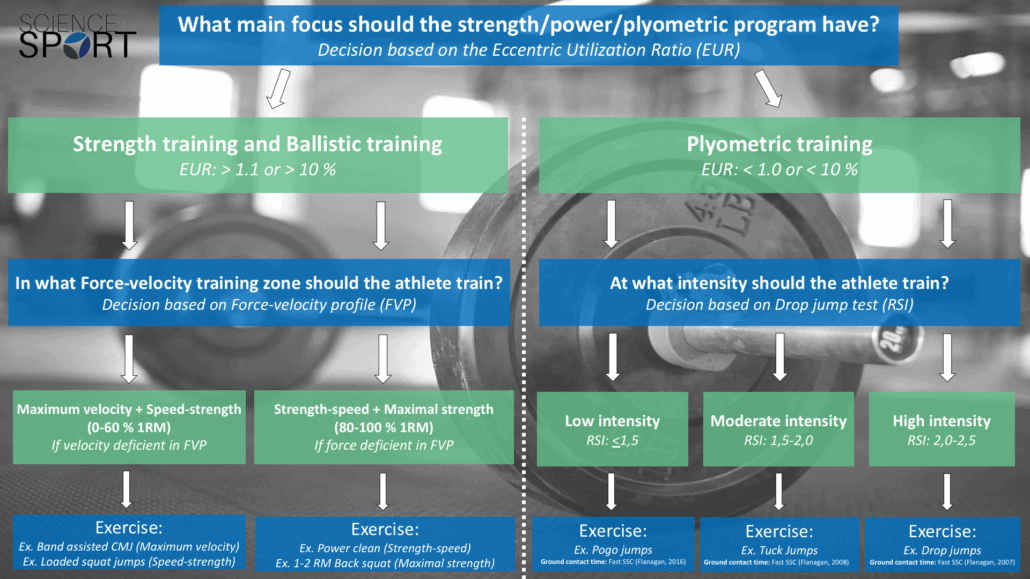
As we have now outlined the characteristics of each lower-body power test and what insight each can provide us with, it is now time to present the decision tree (Figure 3). The decision tree starts from the top and successively follows from thereon out.
The cursive text outlines which test that is used to answer the programming question (blue boxes) and which criterion is used in the evaluation process of each test (green boxes). The blue boxes at the bottom outline which type of exercises could be appropriate for each possible scenario.
Practical Applications
Based on the data collected, is an athlete in need of strength training/ballistic slow SSC training or speed-strength/plyometric fast SSC training?The EUR score can help guide this decision. This should not be an “either-or” approach, as the two separate pathways help decide what the main emphasis of an athlete’s program should be, not the only emphasis.
Depending on the selected pathway, the second question is at which intensity/training zone an athlete should train? In the “strength pathway,” there should be a higher emphasis on maximal strength and strength-speed whereas, in the “plyometric training” pathway, higher emphasis should be placed on speed-strength.
The third question we should answer is which exercises we should prescribe our athletes for our desired outcome. In the decision tree, a few examples of exercises can fit within each category if loaded appropriately and execute with maximal intent. With this decision, S&C coaches should not limit themselves to a program based solely on strength or plyometrics training. Instead, there should be a balance based on the athlete’s previously determined needs, where the decision tree can guide us in which type of exercises our athlete needs to work on more heavily
Conclusion
Many lower-body power tests can give S&C coaches different insights into an athlete’s maximum vertical lower-body power capability. As an S&C coach, it might be confusing how all these different tests should be interpreted when designing strength and plyometric training programs.
This blog post provides you with a framework model (decision tree), that can help you as an S&C coach to interpret data before designing a program which includes individualized strength, strength-speed, ballistic and plyometric exercises with an appropriate balance.
- Balsalobre-Fernandez, C., Glaister, M, Lockey, R. (2015). The validity and reliability of an iPhone app for measuring vertical jump performance. Journal of Sport Science. 33(15), 1574-1579. [Link]
- Cormie, P., McGuigan, M. R., and Newton, R. U. (2011). Developing Maximal Neuromuscular Power. Sports Medicine. 41, 125–146. [Link]
- Chandler, P., Graig, M., and McMahon, J. J. (2018). Variability of plyometric and ballistic exercise technique maintains jump performance. Journal of Strength and Conditioning Research, 32(6), 1677-1682. [Link]
- Flanagan, E. P. (2016). RSI Revisited Part I. [Link]
- Flanagan, E. P. (2007). An examination of the slow and fast stretch-shortening cycle in cross country runners and skiers. XXV ISBS Symposium 2007, Ouro Preto – Brazil. [Link]
- Flanagan, E. P., Ebben, W. P., and Jensen, R. L. (2008). Reliability of the reactive strength index and time to stabilization during depth jumps. Journal of Strength and Conditioning Research, 22(5), 1677-1682. [Link]
- Jiménez-Reyes, P., Samozino, P., Cuadrado-Peñafiel, V., Conceição, F., González-Badillo, J. J., and Morin, J. B. (2014). Effect of countermovement on power–force–velocity profile. European Journal of Applied Physiology. 114, 2281-2288. [Link]
- Mcguigan, M. R., Doyle, T. L. A., Newton, M., Edwards, D. J., Nimphius, S., and Newton, R. U. (2006). Eccentric utilization ratio: Effect of sport and phase of training. Journal of Strength and Conditioning Research, 20(4), 992-995. [Link]
- Nuzzo, J. L., McBride, J. M., Cormie, P., and McCaulley, G. O. (2008). Relationship Between Countermovement Jump Performance and Multijoint Isometric and Dynamic Tests of Strength. Journal of Strength and Conditioning Research, 22(3), 699-707. [Link]
- Petrigna, L., Karsten, B., Marcolin, G., Paoli, A., D´Antona, G., Palma, A., and Bianco, A. (2019). A review of countermovement and squat jump testing methods in the context of public health examination in adolescence: Reliability and feasibility of current testing procedures. Frontiers in physiology. 10, 1-19. [Link]
- Samozino, P., Morin, J, B., Hintzy, F, and Belli, A. (2008). A simple method for measuring force, velocity and power output during squat jump. Journal of Biomechanics. 41(14), 2940-2945. [Link]
- Schmidtbleicher, D. (1992). Training for power events. In P.V Komi (Ed.), The Encyclopeadia of Sports Medicine. Vol 3: Strength and Power in sport (pp. 169-179). Oxford, UK: Blackwell. [Link]
- Suchomel, T., Nimphius, S, and Stone, M. (2016). The Importance of Muscular Strength in Athletic Performance. Sports Medicine. 46. [Link]