Contents of Article
- Summary
- What is the force-velocity curve?
- How do you use the force-velocity curve?
- What are the force-velocity training zones?
- Conclusion
- References
- About the Author
Summary
The force-velocity curve is a physical representation of the inverse relationship between force and velocity. Understanding the interaction between force and velocity and their influences on exercise selection is vital for any strength and conditioning coach. For example, it is essential that a strength and conditioning coach understands the physiological and biomechanical differences between prescribing a one-repetition maximum (1RM) deadlift and five-repetition maximum (5RM) jump squats – as one will produce higher forces and lower velocities than the other. Failure to understand the relationship and its importance will likely lead to less than optimal training prescription.
What is the force-velocity curve?
Though the force-velocity curve may appear confusing and complicated, it is actually very straightforward. The force-velocity curve is simply a relationship between force and velocity and can, therefore, be displayed on an x-y graph (Figure 1). The x-axis (i.e. horizontal axis) indicates velocity – for example, this may represent muscle contraction velocity, or velocity of movement (measured in meters per second). Whilst the y-axis (i.e. vertical axis) indicates force, for example, this may represent muscle contractile force or the amount of ground reaction force produced (measured in Newtons).
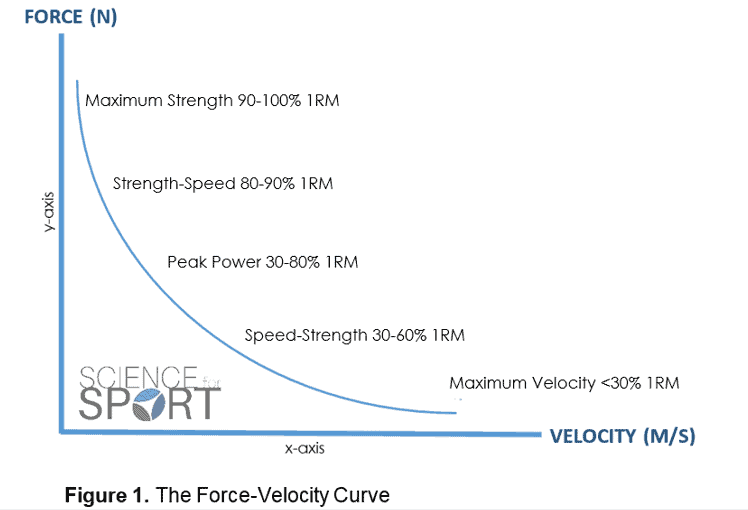
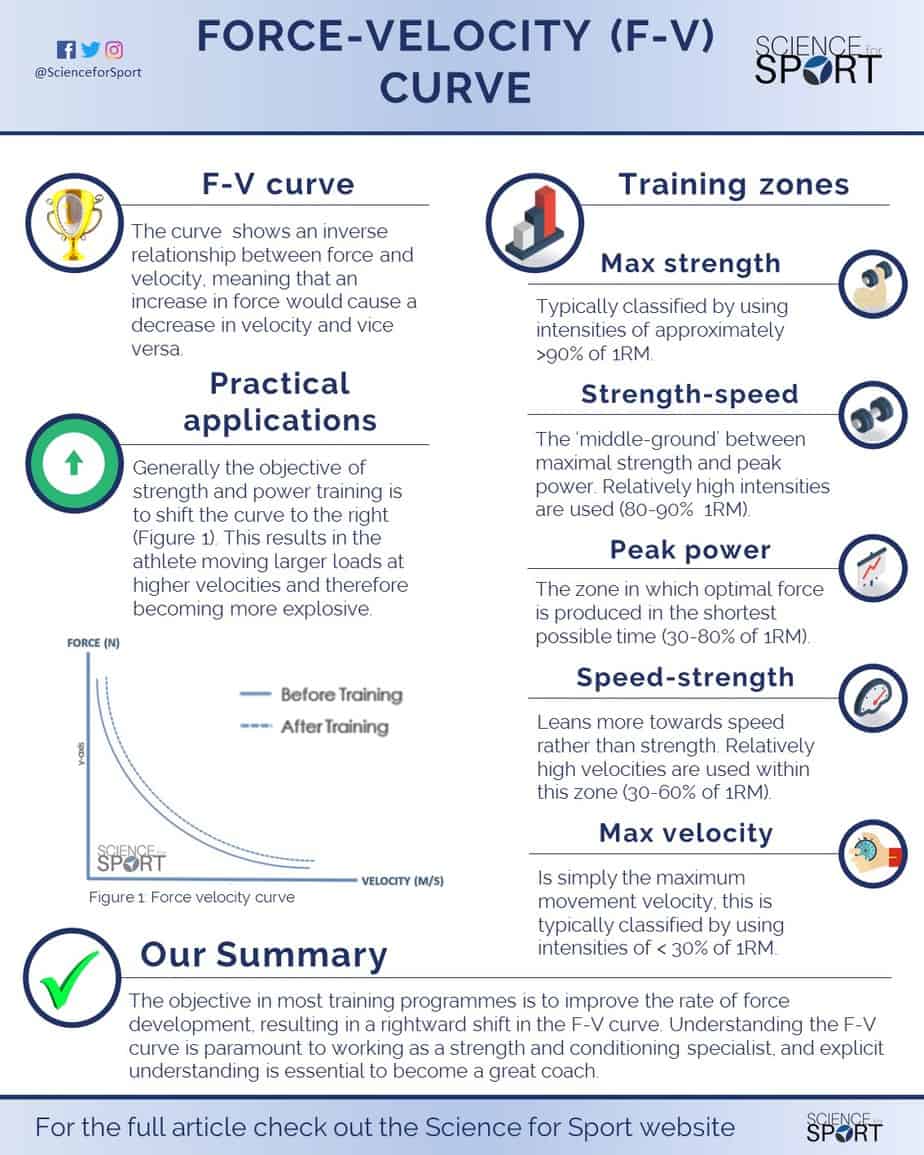
The curve itself shows an inverse relationship between force and velocity, meaning that an increase in force would cause a decrease in velocity, and vice versa. Giving an example, a 1RM back squat would produce high levels of force but would be lifted at a slow velocity. While a counter-movement jump (CMJ) would produce a high movement velocity, it would also only produce low levels of force. This indicates there is a trade-off between force and velocity. That being said, when an exercise produces high levels of force, it will also produce a slow movement velocity and vice versa.
This trade-off between force and velocity is thought to occur due to a decrease in the time available for cross-bridges to be formed – more time equals more cross-bridge formation, and more cross-bridges mean a greater contractile force (1). Therefore, slower velocity exercises allow the athlete to form more cross bridges and develop more force. Higher velocity exercises provide less time for cross bridges to form and therefore result in lower force production.
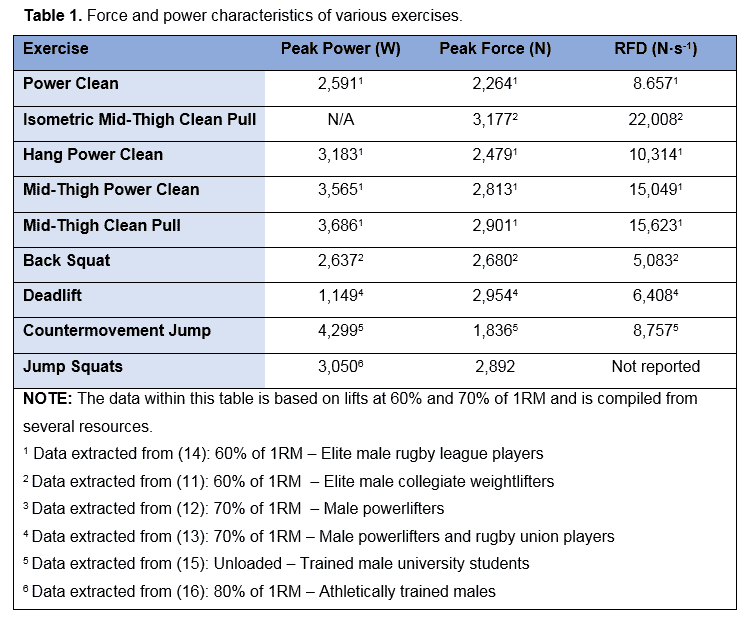
As a result, different exercises and intensities have been categorised into various segments on the force-velocity curve (Figure 1). In addition, Table 1 demonstrates the force and velocity differences between numerous exercises. Here try and note the force and velocity differences between the same exercises at various intensities.
How do you use the force-velocity curve?
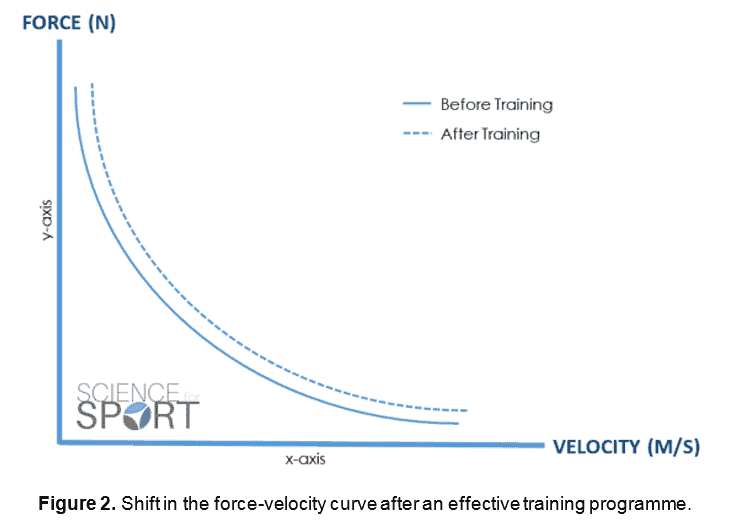
As power is a key determinant in the performances of many sports, optimising an athlete’s power production is of great importance (7, 8, 9, 10, 11, 12). Because power is the product of force multiplied by velocity (Power = Force * Velocity), improving either of these components can lead to increased power production and therefore the explosiveness of the athlete. In most circumstances, the primary objective of strength and power training is to shift the force-velocity curve to the right (Figure 2), resulting in the athlete being able to move larger loads at higher velocities and therefore becoming more explosive.
Shifting the force-velocity curve to the right represents an improved rate of force development (RFD). The RFD simply reflects how fast an athlete can develop force. An athlete with greater RFD capabilities will be more explosive as they can develop larger forces in a shorter period of time.
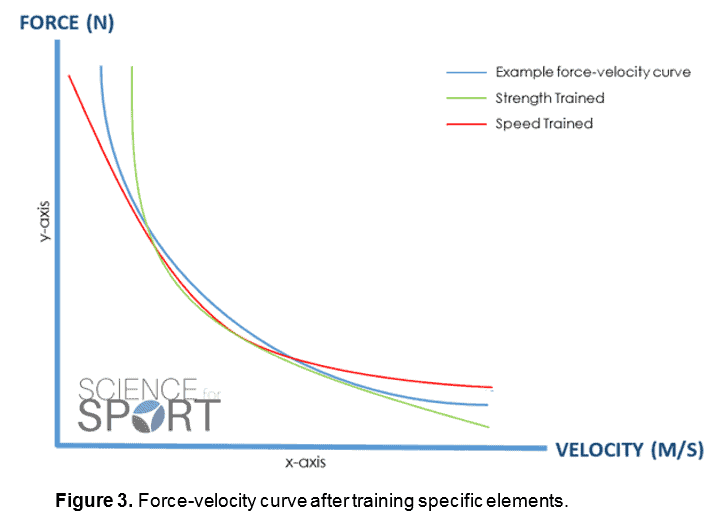
By only training on one part of the force-velocity curve (e.g. maximum strength), it is likely that the athlete will only improve their performance at that section on the paradigm (Figure 3). For example, only training maximal strength may lead to improvements in force production, but it may also result in a reduction in muscle contractile velocity. As training programmes that combine strength and power training have been repeatedly shown to improve athletic performance more than strength or speed training alone (13), there is no surprise that most strength and conditioning coaches commonly use an all-rounded approach within their programming.
Although most athletes should typically train at each section along the force-velocity curve, the time spent at each zone is dependent on many factors. Some primary considerations include:
- Training age
- The individual’s strengths and weaknesses
- Training objectives
- The sport and position of the athlete
- Time of year/season/stage of the macrocycle
Therefore all parts of the force-velocity curve should typically be trained in order to maximise the explosiveness of the athlete. With that being said, there is often great debate about training multiple components of the force-velocity curve during one microcycle, or whether it is more effective to segregate it into separate blocks. Though this is an important topic, it is inherently tied to training periodisation and is too broad for the scope of this article.
What are the force-velocity training zones?
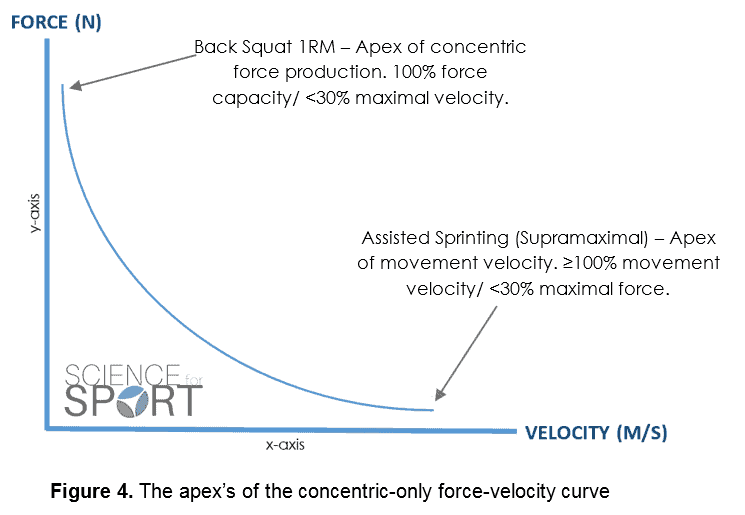
These zones are classified by the percentage of maximal strength or velocity an athlete can produce. For instance, if an athlete’s maximal force production during a Back Squat 1RM is 3000 Newtons (N), then this would typically represent 100% of their maximal strength capacity, and therefore appear at the apex of the concentric-only force curve (Figure 4). The force percentage then works its way down the curve until it reaches the maximal velocity where little force is produced. Likewise, the maximal velocity represents ≥ 100 % of the athlete’s maximal velocity of movement and appears at the apex of the velocity curve (Figure 4).
Maximal Strength
Maximal strength is simply the maximum amount of force someone is able to produce through a specific movement. For example, a 1RM back squat would represent the maximum amount of force an athlete can produce during that particular exercise. Therefore, this training zone is typically classified by using intensities of approximately > 90 % of 1RM.
Exercise examples include: Back squat, deadlift, and bench press at 90-100 % of 1RM, or any other exercise using this range of intensity.
Strength-Speed
This is a classification for exercises that are not deemed to deliver peak power output, nor peak force, so it sits in a so-called ‘middle-ground’ between maximal strength and peak power. As relatively high intensities are used within this zone (80-90 % of 1RM), it leans more towards strength rather than speed – hence the ‘strength’-speed. The strength-speed zone requires an athlete to produce optimal force in a shorter time frame than the maximal strength zone, and as discussed earlier, this reduces the amount of force that can be produced. Therefore, whilst the strength-speed zone may produce lower peak forces than the maximal strength zone, it is able to achieve higher movement velocities.
Example exercises include: Olympic lifts (i.e. Snatch, Clean & Jerk, Snatch Press at 80-100 % of 1RM).
Peak Power
This is a classification zone for exercises deemed to deliver peak power output. These exercises typically produce the greatest amount of force in the least amount of time. Essentially, power sits in the middle of strength-speed and speed-strength producing the optimal amount of force in the shortest time frame possible (30-80 % of 1RM).
Example exercises include: Second pull variations of the Clean and Snatch, Jump Squats, and Bench Press Throw at 30-80 % of 1RM.
Speed-Strength
Similar to strength-speed, this zone does not deliver peak power, nor peak velocity, so it sits in a ‘middle-ground’ between maximal velocity and peak power. Peak force would be expected to be even lower here compared to strength-speed due to the greater restriction on time available; however, movement velocities will be higher. As relatively high velocities are used within this zone (30-60 % of 1RM), it leans more towards speed rather than strength – hence the ‘speed’-strength.
Example exercises include: Slow stretch-shortening plyometric drills such as: counter movement jumps, and single-leg high hurdle jumps. Light-loaded Jump Squats (30-60 % of 1RM).
Maximal Velocity
Maximal velocity is simply the maximum movement velocity or muscle contractile velocity an athlete is able to produce through a specific movement. For example, a 100m sprint may represent the maximum movement velocity an athlete can produce during that particular exercise. Whereas, assisted sprinting, otherwise known as ‘supramaximal sprinting’ can produce ≥ 100 % movement velocities. Therefore, this training zone is typically classified by using intensities of approximately < 30 % of 1RM.
Exercise examples include: Fast stretch-shortening plyometric drills such as: hopping, bounding, sprinting and assisted sprinting.
These different training zones are merely guidelines for various intensities and can be manipulated to fit the athlete in hand. They have been developed by exercise professionals for educational purposes in order to demonstrate the effects of different exercises and intensities on athletic performance. However, each training zone, or section of the force-velocity curve, will provide different physiological adaptations and therefore may have its own benefit for the athlete. For example, if an athlete is very strong (i.e. has a high 1RM), but performs poorly during speed tests (e.g. 20m sprint test), then spending time at the maximal velocity and speed-strength zones may be of great benefit for the athlete.
Conclusion
The force-velocity curve demonstrates a simple inverse relationship between force and velocity – meaning an increase in one results in a concurrent decrease in the other. This has strong implications for planning a training programme and should be thoroughly considered when doing so. If an athlete lacks strength but is extremely fast, then perhaps more time should be spent training at higher force intensities to improve their strength capacity. The objective in most athletic training programmes is to improve the athlete’s rate of force development (i.e. their explosiveness), resulting in a rightward shift in the force-velocity curve. Understanding the force-velocity curve is paramount to working as a strength and conditioning specialist, and explicit understanding is essential to becoming a great coach.
- Zatsiorsky, V., and Kraemer, J. (2006). Science and Practice of Strength Training. Champaign, Illinois: Human Kinetics. [Link]
- Aspe, RR and Swinton, PA. Electromyographic and kinetic comparison of the back squat and overhead squat. J Strength Cond Res 28(10): 2827–2836, 2014 [PubMed]
- Swinton, PA, Lloyd, R, Keogh, JWL, Agouris, I, and Stewart, AD. A biomechanical comparison of the traditional squat, powerlifting squat, and box squat. J Strength Cond Res 26(7): 1805–1816, 2012. [PubMed]
- Swinton, PA, Stewart, AD, Keogh, JWL, Agouris, I, and Lloyd, R. Kinematic and kinetic analysis of maximal velocity deadlifts performed with and without the inclusion of chain resistance. J Strength Cond Res 25(11): 3163–3174, 2011 [PubMed]
- Cronin, J.B., McNair, P.J., & Marshall, R.N. (2003). Force-velocity analysis of strength training techniques and load: Implications for training strategy and research, Journal of Strength and Conditioning Research, 17(1), pp.148-155. [PubMed]
- Hori, N, Newton, RU, Kawamori, N,McGuigan,MR, Kraemer,WJ, and Nosaka, K. Reliability of performance measurements derived from ground reaction force data during countermovement jump and the influence of sampling frequency. J Strength Cond Res 23(3): 874–882, 2009 [PubMed]
- Baker, D and Nance, S. (1999). The relation between strength and power in professional rugby league players. Journal of Strength and Conditioning Research, 13: 224–229. [Link]
- Comfort, P, Allen, M, and Graham-Smith, P. (2011). Kinetic comparisons during variations of the power clean. Journal of Strength and Conditioning Research, 25: 3269– 3273. [PubMed]
- Comfort, P, Fletcher, C, and McMahon, JJ. (2012). Determination of optimal load during the power clean in collegiate athletes. Journal of Strength and Conditioning Research, 26: 2970–2974. [PubMed]
- Cormie, P, McBride, JM, and McCaulley, GO. (2007). Validation of power measurement techniques in dynamic lower body resistance exercises. J Appl Biomech 23: 103–118. [PubMed]
- Cronin, J, McNair, PJ, and Marshall, RN. (2001). Developing explosive power: A comparison of technique and training. J Sci Med Sport 4: 59–70. [PubMed]
- Garhammer, J. & Gregor, R. (1992). Propulsion Forces as a Function of Intensity for Weightlifting and Vertical Jumping, J. Appl. Sports Sci. Research, 6(3): 129-134. [Link]
- Stone, M.H., (1993). Literature review: Explosive exercises and training. National Strength and Conditioning Association Journal, 15(3), pp.7-15. [Link]