
Contents of Article
- Summary
- What is velocity-based training?
- Why is velocity-based training useful?
- How is velocity-based training used?
- Load-velocity profiling and predicting 1RM
- Minimal velocity thresholds
- Exertion-load profiling
- Provide augmented feedback
- Autoregulation: Training adjustment to optimise loads
- Identifying and targeting specific training qualities
- Conclusion
- References
- About the Author
Summary
Velocity-based training appears to be a valuable tool for strength and conditioning coaches, personal trainers and others alike. The most commonly used technologies appear to be linear position transducers and accelerometers, examples of which are the GymAware device and the PUSH Band, respectively. More recently, a high-precision laser optic device called “FLEX” has also entered the market. Using the data collected from the devices, in certain circumstances, they appear to be a valid and somewhat reliable tool for predicting one-repetition maximum (1RM) using sub-maximal loads.
In addition to this, velocity-based training can be used for many other useful purposes, such as providing instantaneous feedback to athletes to promote performance improvements. However, whilst this training tool appears to have many useful functionalities, coaches should not get distracted by the technology and forget what it is they are actually there to do, which is to coach.
What is velocity-based training?
Velocity-based training is simply a method of training which uses a piece of technology to track the movement speed of the exercise. The concept of velocity-based training is nothing new and can, in fact, be traced back several decades (1-4). It is only due to the development of technology, accessibility of information provided by the internet, and the development of business enterprises taking advantage of a niche within the market that has propelled the concept and application of velocity-based training in recent years.
This explosion of interest has led to some very interesting developments, both in the application and the technology. For example, using linear position transducers and wearable accelerometers, we can accurately calculate barbell velocity, and thus produce an athlete’s load-velocity profile. But before we dive into this complex jargon, we will first explain what velocity-based training is and why it is useful.
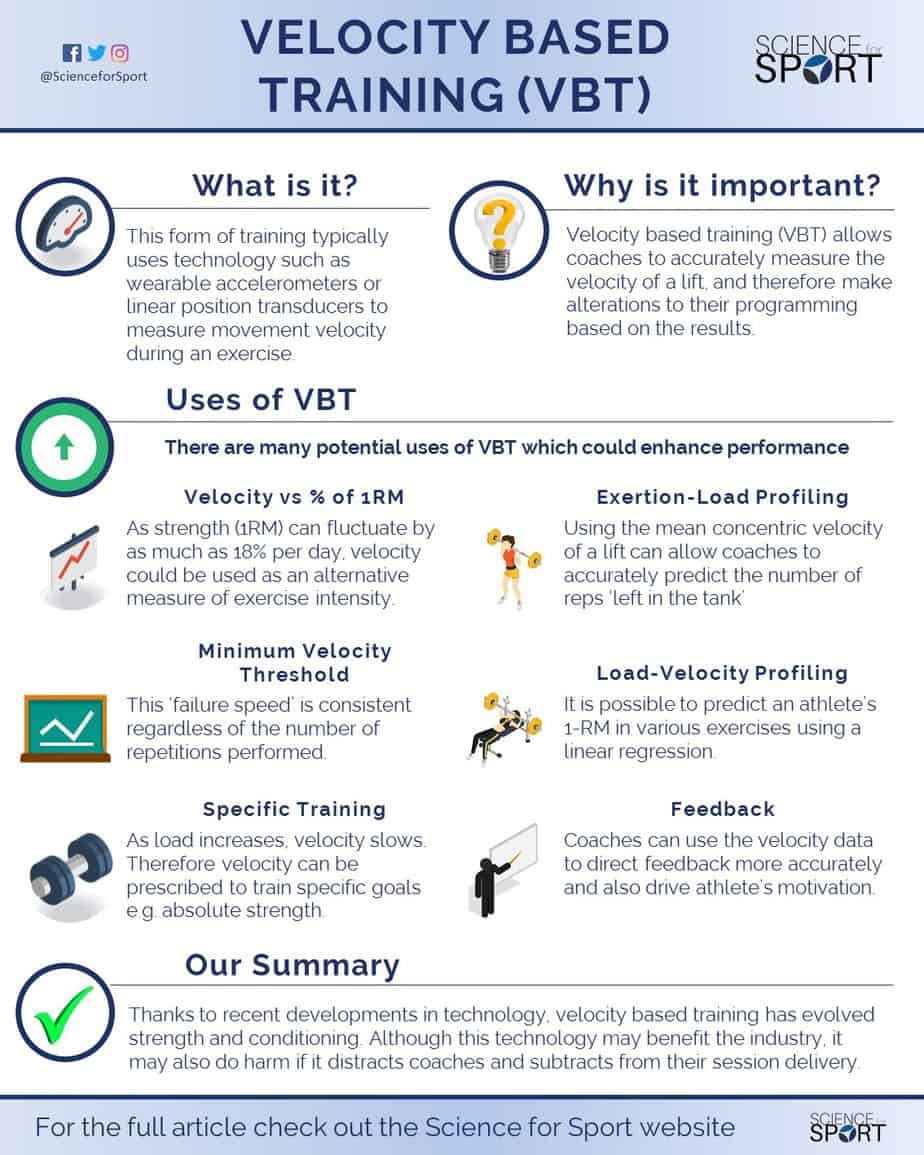
So whilst the concept is not new, the common practice of using this method is. This form of training typically uses technology such as linear position transducers (e.g. GymAware device), laser optic devices (e.g. FLEX), and wearable accelerometers (e.g. PUSH Band) to measure movement velocity during an exercise (e.g., back squat). This provides the coach and athlete with information regarding their exercise performance and allows the coach to provide very specific feedback (e.g. “lift the barbell quicker or be more explosive”).
Why is velocity-based training useful?
Velocity-based training allows coaches and athletes to train at very specific intensities. For example, if two completely identical athletes with the same strength levels etc performed an 80% of 1RM back squat, but one only lifted the bar with maximal effort whilst the other did not, would the intensity of the lift be the same? The answer is no. The intensity will be higher for the athlete who tried harder than the other, as it is more physically demanding to lift the bar with maximal effort.
Therefore, VBT enables athletes to train at the appropriate intensity, which ensures that they are training optimally to achieve their desired performance outcomes. To add to this, research has shown that velocity-based training can significantly improve an athlete’s performance.
When strength and conditioning coaches, personal trainers, physiotherapists and other gym-based practitioners alike design resistance training programmes for their athletes and clients, they typically manipulate many training variables such as intensity, volume, rest, frequency, tempo etc. Whilst many of these are very easy to measure, for example, intra-set rest times may be one minute and the athlete may be given a training frequency of three sessions per week, other variables such as intensity are not so simple to calculate.
Intensity is difficult to measure.
Training intensity, for instance, has historically been calculated as a percentage of the athlete’s 1RM. An athlete’s 1RM is often determined by testing their maximal strength before the start of a new programme, and after they have completed it. This allows the practitioner to identify if the athlete has improved their strength throughout the programme – simple right?
This approach, using a percentage of 1RM, is often referred to as either the “traditional” or “percentage-based” approach to calculating training intensity (5). However, this method becomes very problematic when we consider the day-to-day fluctuations in strength, which have been shown to be as large as 18 % above and below the previously tested 1RM, equating to a total variance of 36 % (5-7).
To provide a crude example, strength levels before a rugby match are likely to be very different to those the day after, therefore, prescribed training loads based on a percentage of 1RM need to be continuously adjusted to suit the ‘freshness’ of the athlete. Figure 1 should help visualise the effects of daily fluctuations in strength.
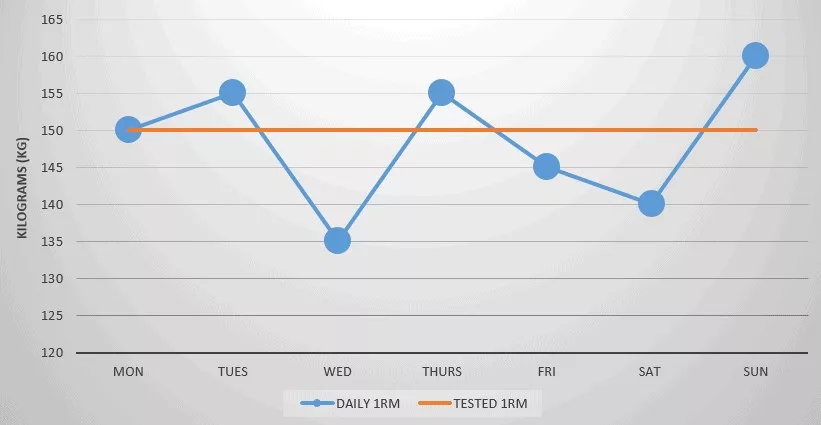
From the hypothetical graph, it is apparent that an athlete’s 1RM can, and does, change on a daily basis. This simply means that an 80 % of 1RM back squat on a Monday may not be equal to 80 % of 1RM back squat on a Tuesday. In an attempt to end this dilemma, modern technology has enabled practitioners to measure movement velocity as a marker of intensity rather than the percentage of 1RM. Say hello to Velocity-Based Training!
There are also several other reasons why this method is useful, but we will discuss these in the next section, so keep reading to find out.
How is velocity-based training used?
As many practitioners have now adopted this form of training, more minds mean more ideas, and as a consequence, there are now many other ways to use velocity-based training (5, 8, 9). Most of these include:
- Load-velocity profiling and predicting 1RM
- Minimal velocity thresholds
- Exertion-load profiling
- Providing augmented feedback
- Autoregulation
- Identifying and targeting specific training qualities
We understand these are some big, elaborate, and to be quite honest, overly complicated words, so what we have done for you is describe them all in simple English – at least as best as we could.
First and foremost, we need to clarify three metrics and why they are used for different exercises:
- Mean concentric velocity – this is simply the average speed during the entire concentric phase of the exercise. This metric is used for typical strength-based exercises such as the back squat, deadlift, bench press, prone pull and others alike. As strength-based exercises consist of acceleration and deceleration phases, the mean concentric velocity metric should be used.
- Peak concentric velocity – this is simply the peak speed during the concentric phase of the exercise and is usually calculated every 5 milliseconds. This metric is used for ballistic/power-based exercises such as the power clean, snatch, bench press throw, and jump squat. As ballistic/power-based movements consist of an acceleration and a trajectory phase, mean concentric velocity would not be appropriate, and therefore peak concentric velocity should be measured instead. Additionally, and perhaps more importantly, during certain power-based movements such as the Power Clean, the first pull phase is often slow, whilst the second pull is explosive and very fast. Using mean concentric velocity would, therefore, skew the data, so in this instance, peak concentric velocity is more appropriate.
- Mean propulsive velocity – It is important to understand what this metric is, and how it differs to mean concentric velocity. According to Gonzalez-Badillo (10), the propulsive phase is defined as the “portion of the concentric phase during which the measured acceleration (a) is greater than the acceleration due to gravity (i.e., a ≥ −9.81 m·s−2).” In other words, the section of the concentric phase which is ≥ − 9.81 m·s−2.
Load-velocity profiling and predicting 1RM
Is predicting 1RM valid and reliable?
As load and velocity have a very close relationship (i.e. when one increases, the other decreases (10-14), it is possible, in certain circumstances, to predict an athlete’s 1RM on various exercises using a statistical method known as “linear regression” (5, 15).
This method of predicting 1RM has been shown to have a reliability of ≥ 95 % for the Smith machine half-squat and both the free-weight and Smith machine bench press with a pause when using the mean propulsive velocity (16, 17). Additionally, the PUSH Band (a velocity-based training device), has also been shown to reliably predict peak velocity and power during the countermovement jump – although they were slightly overestimated (18).
However, other research that used the standard free-weight back squat and bench press, and used mean concentric velocity, reported that velocity measures cannot be used to accurately predict actual 1RM (11, 12). The reasons these findings conflict with earlier research are:
- Velocity is less stable/inconsistent at lighter loads – hence why the heavier the load, the more accurate the 1RM prediction. Therefore, the load-velocity relationship is not perfectly linear. In other words, the lighter the load, the higher the error (17).
- Certain exercises (e.g. free-weight back squat) have a long deceleration phase at the end of the concentric portion (13, 14), therefore, using mean concentric velocity will overestimate movement velocity. This is part of the reason mean propulsive velocity is a better metric to use in this circumstance, as it only measures the ‘accelerative’ phase.
- The inclusion of the stretch-shortening cycle: Exercises that incorporate the stretch-shortening cycle cause an increase in concentric velocity due to the recoiling action of the movement (15). This increase in velocity is likely to cause greater inconsistencies in the concentric velocity measure (i.e. mean concentric velocity or mean propulsive velocity), therefore, influencing the reliability of the 1RM prediction. As such, exercises which use a pause are more likely to produce better 1RM predictions due to a more stable concentric velocity measure.
To clarify, actual 1RMs are most accurately predicted when using heavier loads, Smith machine variations, mean propulsive velocity, and exercises which incorporate a pause to eliminate the stretch-shortening cycle. When a coach is attempting to predict actual 1RM and not using the aforementioned points, the prediction is likely to be inaccurate. Simply meaning, attempting to predict actual 1RM using the standard back squat and bench press exercise with mean concentric velocity is not recommended.
How to predict an athlete’s 1RM
To predict an athlete’s 1RM, the coach must first develop a ‘load-velocity profile’ of the athlete by recording their movement velocities at each load (e.g. 0.8 m/s at 60 % 1RM; Figure 2). A load-velocity profile allows the coach to easily see how fast an athlete can lift a load at a given percentage of their 1RM (e.g. 60 %).
“When the load (i.e. weight) of the exercise increases, the movement velocity decreases.”
If you want to learn more about this relationship, then read our article on the “Force-Velocity Curve”.
Load-velocity profiling is a method which uses a series of repetitions, either with relative or absolute loads, to produce a force-velocity profile for a specific exercise. Figure 2 shows a hypothetical load-velocity profile for an athlete’s bench press performance. Note how when the load/weight goes up, the velocity decreases and vice versa.
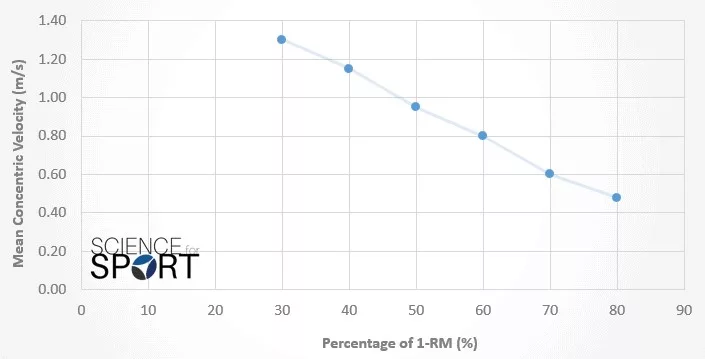
It is currently recommended that coaches measure the mean propulsive velocity over at least 4-6 increasing intensities using loads of between 45-95 % of actual, or predicted, 1RM as seen above in Figure 2 (17).
NOTE: the heavier the loads, the greater the prediction accuracy due to the points formerly discussed.
Figure 3 demonstrates how to perform this test with greater detail. Previous research has suggested that the velocity difference between the lightest load (e.g. set 1) and the heaviest load (e.g. set 6) should be at least 0.5 m/s apart (5, 18).
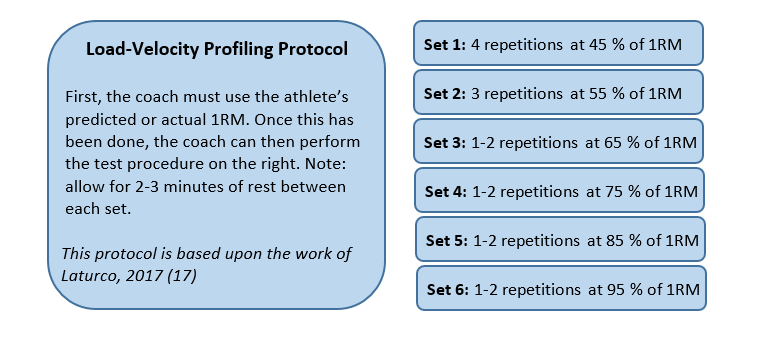
Figure 3 – Load-Velocity Profiling Protocol (based on Laturco, 2017 (17))
When performing a bench press, for example, it is vital that the athlete attempts to move the barbell as quickly as possible during the concentric phase. The highest mean propulsive velocity recorded during each load should then be used to compute the load-velocity profile (17).
With this in mind, the athletes should be encouraged to maintain strict technical form, and it is the coach’s job to ensure this happens. As such, the coach must pay strict attention to technical execution.
Minimal velocity thresholds
Despite the confusing name, minimal velocity thresholds (MVT), otherwise known as 1RM velocities, are actually very simple. MVTs are the average concentric velocity produced during the last successful repetition. For example, the velocity produced during a 1RM, or alternatively, the velocity produced during the last successful repetition during a repetitions-to-failure test (e.g. nine repetition maximum (9RM)).
In other words, it is the average speed during the concentric phase of a 1RM (i.e. average concentric velocity). With this in mind, it is no surprise that they are often referred to as 1RM velocities.
“Example: the MVT is the average speed during the ascent phase of a 1RM back squat.”
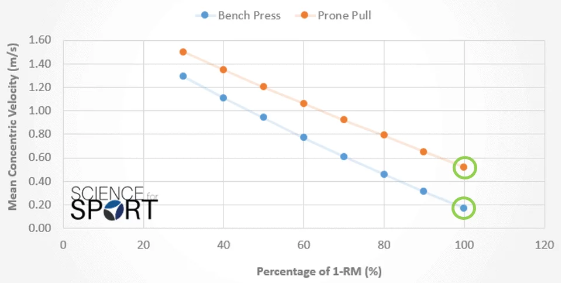
It is very important to understand that these MVTs are exercise specific. For example, whilst 1RM velocities of 0.17 m/s have been reported in the bench press, 1RM velocities of 0.52 m/s have been reported during the prone pull (23). Figure 4 displays how the MVTs differ between two common exercises: the bench press and prone pull.
NOTE: the MVTs are highlighted in green and are the two lowest points for each exercise.
The interesting and arguably most useful piece of information with MVTs is that the MVT is consistent and appears to be same during a maximal 1RM test, or on the last repetition of a sub-maximal repetitions-to-failure test (e.g. 9RM (24)). For example, Izquierdo and his colleagues (24) found that when subjects performed the bench press and squat with repetitions-to-failure using intensities of 60, 65, 70 and 75 % of 1RM, the MVT on the last repetition were always the same. It was also noted that the MVTs for the last repetition of these intensities (60, 65, 70 and 75 % of 1RM) are also the same as the MVT during a maximal 1RM test.
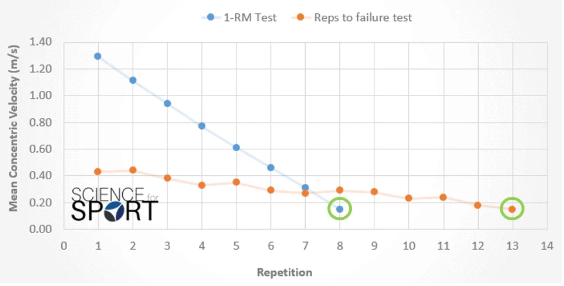
Overall, this suggests that the MVT of a final repetition is the same regardless of whether a sub-maximal repetitions-to-failure test is used (e.g. 9RM), or if a maximal 1RM test is used. This means that the mean concentric velocity during a 1RM test can be calculated using a repetitions-to-failure test. Figure 5 demonstrates how the MVT is the same for both a 1RM and a repetitions-to-failure test. Again, both are highlighted in green.
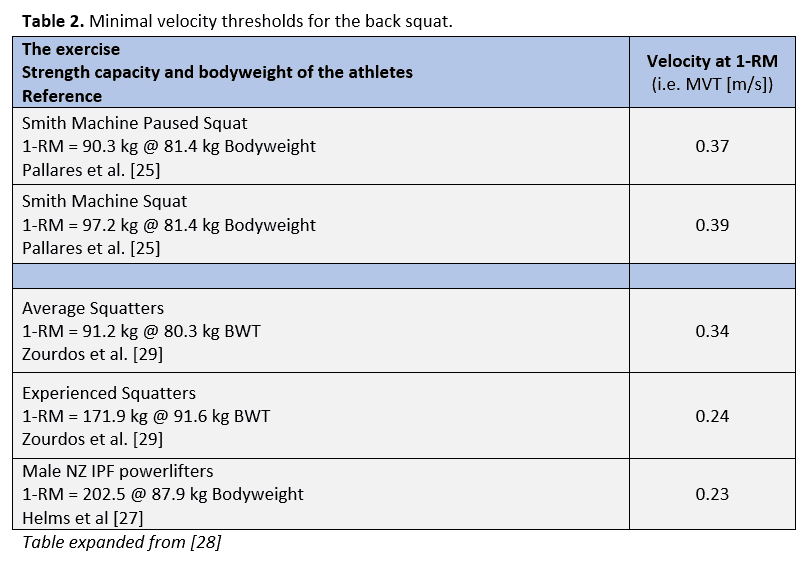
Tables 1 and 2 show how the MVTs remain relatively similar for a given exercise, but are very different between exercises (bench press vs. back squat). As can be seen in Table 1, the MVTs vary slightly between athletes, with the strongest athletes often being capable of producing the lowest MVTs (bottom half of the table). Perhaps an athlete’s ability to ‘grind out’ a low MVT is due to motivation and exercise experience.
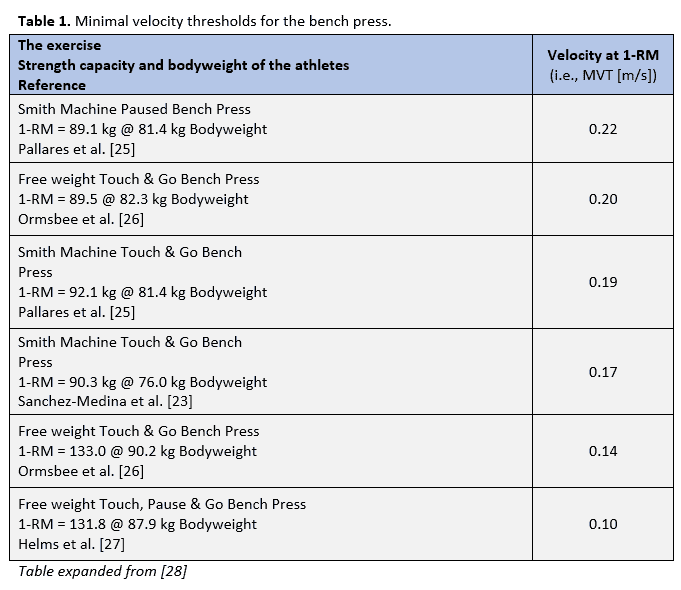
To add to this, it appears that the MVT of an exercise remains the same regardless of whether an athlete gains strength or not (10, 18), but it has not been identified if the same is true when an athlete loses strength. However, what is extremely important to remember, is that whilst MVTs may remain constant across both sub-maximal repetitions-to-failure and maximal 1RM tests, these speeds appear to be different for every exercise and each athlete.
On a practical note, because MVTs appear to be constant between sub-maximal and maximal tests, practitioners can use this information to identify if an athlete is actually attempting a 1RM or not. If the practitioner feels the athlete is not providing a true 1RM effort, perhaps the use of a sub-maximal repetitions-to-failure test would be more appropriate.
Exertion-load profiling
Again, this sounds very complicated, but exertion-load profiling works very similarly to MVTs, and in some way can be seen as a simple extension of them.
By now you should understand that the MVT between a 1RM test and the last repetition of a sub-maximal repetitions-to-failure test are extremely similar, if not the same. Well, what is interesting, is the mean concentric velocity also appears to remain constant for the ‘repetitions in reserve’ (i.e., reps left in the tank) across a spectrum of intensities (60, 65, 70 and 75 % of 1RM) (24). To make this clearer, Table 3 demonstrates how the mean concentric velocity remains constant when an athlete has 𝑥 number of ‘reps left in the tank’.
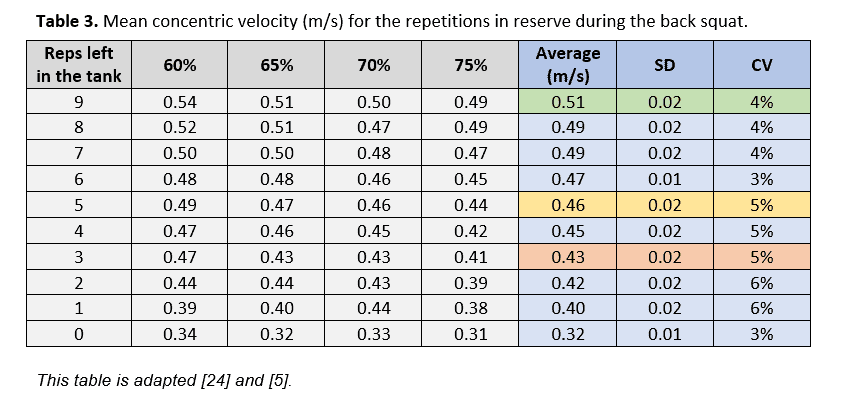
Remembering that the ‘repetitions in reserve’ simply means how many repetitions an athlete has left in the tank, by looking at Table 3 it becomes obvious that if an athlete has, for example, nine repetitions left in the tank, the mean concentric velocity remains fairly constant, with a deviation (SD) of only 0.02 m/s (highlighted in green).
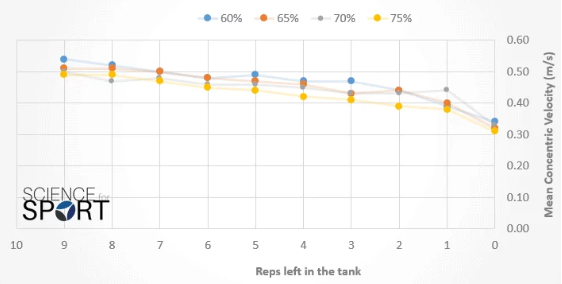
The same applies if the athlete has five repetitions left in the tank (highlighted in orange). Figure six visually demonstrates the consistency of the mean concentric velocities and the repetitions in reserve.
Because of this consistency, a coach can understand how many repetitions the athlete has left in the tank during any given set, provided the athlete is performing the exercise with maximal effort. For example, if an athlete achieves a mean concentric velocity of 0.43 m/s during the squat, the coach can estimate that the athlete may have approximately 3 repetitions left in the tank (Table 3: highlighted in red) – assuming, of course, the athlete is giving it their maximal effort.
It is important to remember that the mean concentric velocity and repetitions in reserve can vary between exercises and athletes, highlighting the importance of building individual profiles for each athlete. So whilst this data provides a reference point, you cannot simply use these velocity profiles, you must measure your own athletes.
Provide augmented feedback
This method of using velocity-based training is very straightforward and has been shown to provide very good improvements in performance (30-32).
Augmented feedback simply refers to using the velocity data to direct coach feedback more accurately and also drive athlete motivation.
In other words, using the data to motivate the athlete and/or provide other useful feedback. For example, if the coach is monitoring an athlete’s jump squat performance and wishes them to ‘explode’ more powerfully out of the bottom position, they may challenge the athlete to beat each of their previous repetition velocities.
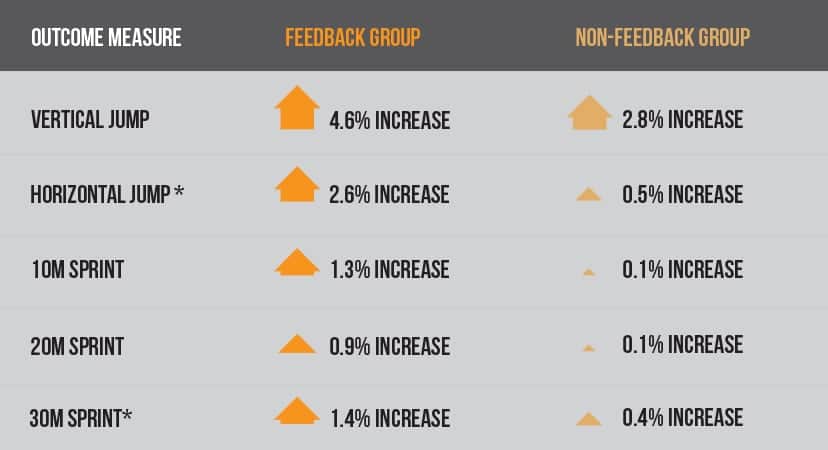
This form of augmented feedback may improve athlete motivation and drive greater neuromuscular adaptations. In fact, previous research has shown that instantaneous feedback during loaded jump squats using velocity-based training can significantly enhance jump performance and sprint times (30). Other research has also shown that augmented feedback can increase jump height both in the short term and over a long period of time (31, 32). Figure 7 provides an example of performance improvements seen by using augmented feedback.
Autoregulation: Training adjustment to optimise loads
Autoregulation has previously been defined by as “a form of periodisation that adjusts to the individual athlete’s adaptations on a day-to-day or week-to-week basis” (34).
This method of using velocity-based training is perhaps best described when thinking about the daily fluctuations in strength, as previously discussed. Because strength, and the ‘freshness/readiness’, of an athlete changes on a daily basis (Figure 1 – see above), velocity-based training allows the coach to adjust the training to fit the freshness of the athlete.
For example, if an athlete comes into the gym feeling tired and lethargic and their 1RM is roughly 15kg lower than what it may have been two days ago (Figure 1; Monday vs. Wednesday), then the coach can adjust the training loads in order to match their readiness to train. This ensures coaches get the stimulus, and hopefully adaptation, they were aiming for.
Let’s provide a real-world example: Imagine an athlete walks into the gym and they are programmed to perform the back squat for five sets at 75 % of their 1RM. Well given the fact their 1RM today may be 15 kg lower than it was two days ago when their 1RM was determined, this 75 % load may actually be closer to 85-90 % of their 1RM. This may explain why athletes feel strong on one day, and weaker on others.
To elaborate on this, research has shown that the traditional approach of training to repetition failure does not necessarily lead to greater increases in strength and/or hypertrophy (35, 36); potentially because effort and overall volume-load (load * reps * sets) are reduced due to fatigue. In fact, one study (37) has reported that the traditional approach of training using self-selected repetition velocity was less effective for developing strength when compared to a velocity-based approach, whereby sets were terminated when the repetition velocity dropped below a 20 % threshold; known as a ‘cut-off velocity’.
Cut-off velocities, also known as velocity stop values, are used to terminate/stop a set when the mean concentric velocity of a repetition falls below that value. Experts have suggested using cut-off velocity values of 30 % in the squat, and 35 % in the bench press (28). This means that when an athlete’s repetition velocity drops by more than 30% in the back squat, then the set should be terminated to prevent them from performing unnecessary repetitions and hampering the desired adaptation.
Cut-off velocities, also known as velocity stop values, are used to terminate/stop a set when the mean concentric velocity of a repetition falls below that value.
There are two common ways of using cut-off velocities:
- The cut-off value (e.g. 30 %) is determined based upon the athlete’s first repetition velocity.
- The coach can pre-determine cut-off values based upon the athlete’s load-velocity profile.
Though both of these methods are useful, the first method is perhaps the easiest and most accurate since any pre-determined cut-off values used in the second method can be affected by daily fluctuations in athlete freshness. Not only this, but many velocity-based training devices display the velocity drop-off anyway.
Now without trying to overcomplicate things and overload your brain, you should be able to see how cut-off velocities correspond to the repetitions in reserve, and therefore, allows the coach to prescribed loads and/or terminate sets when an athlete has a set number of ‘reps left in the tank’.
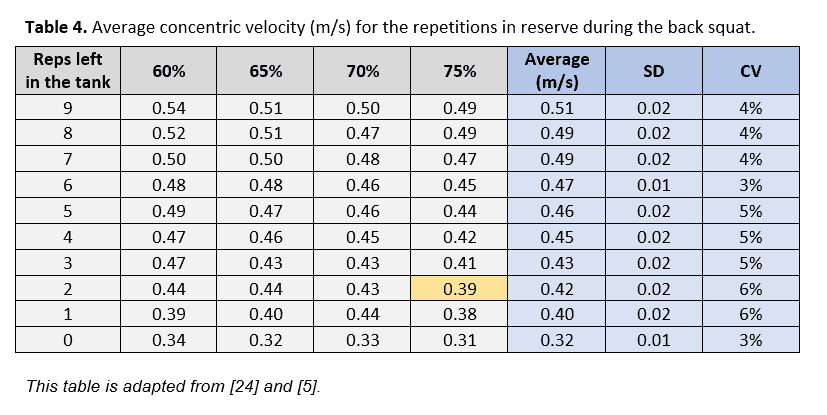
Using Table 4 as an example, if an athlete is performing a set of back squats using 75 % of their 1RM and their mean concentric velocity drops to 0.39 m/s, the coach can determine that the athlete has approximately 2 reps left in the tank (highlighted in orange). Being able to identify how many repetitions an athlete has left in the tank allows the coach to adjust the training load and volume in order to target the desired physical quality.
What is not currently known, is whether there is a set number of reps left in the tank which is the best for gains in muscle mass. It is now well-known that volume load is directly related to increases in muscular hypertrophy (38), and that training to failure is not necessarily the best method of developing muscle mass (36), so it may be a question of which reps in the tank, in combination with volume-load, is optimal for stimulating gains in muscle size.
Reducing the effects of fatigue
The usage of velocity-based training to reduce the effects of fatigue during strength training is relatively straightforward. It is based on the principle that when fatigue develops, velocity slows.
“When fatigue develops, velocity slows.”
Because of this, coaches can estimate metabolic stress and neuromuscular fatigue. Figure 8 shows how velocity slows as fatigue develops. Metabolic fatigue (Figure 8-A; lactate accumulation) increases in a linear fashion, whilst neuromuscular fatigue (Figure 8-B; ammonia) develops in a curvilinear fashion (8).
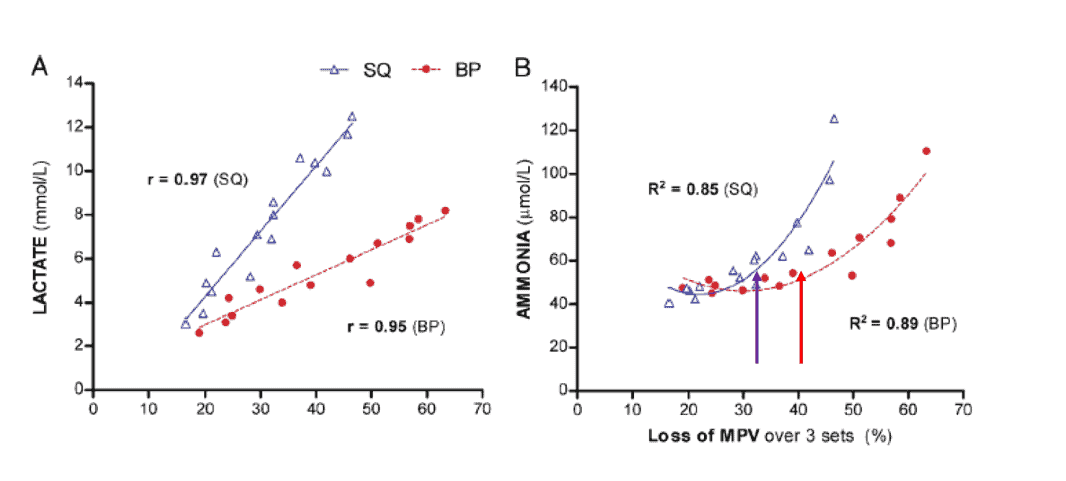
Based on the limited research, expert opinion suggests that the cut-off velocities of 30 % in the back squat and 35 % in the bench press can be used to limit metabolic stress (28). By doing so, the coach is able to optimise the training stimulus by limiting the hampering effects of fatigue. So for example, if an athlete is performing the back squat at 75 % of their 1RM with an average concentric velocity of 0.5 m/s and the velocity drops by 30 % to 0.35 m/s, then the coach can terminate the set to prevent any desired accumulation of fatigue. Of course, this is assuming the coach does not want the fatigue to develop, and that the athlete is performing each repetition with maximal effort.
If the athlete is lazy, or for any reason does not perform the repetition with maximal effort (i.e. lift the barbell as quickly as possible), then the information might not be accurate. So the coach must watch the athletes, as well as have a level of trust that they are lifting with maximal effort.
Identifying and targeting specific training qualities
The proliferation of velocity based training has led to the understanding and improvement of the force-velocity relationship. Previously the relationship between force and velocity has historically been displayed via the Force-Velocity Curve. However, it is well-known that force and velocity do not always interact in a curvilinear fashion as they are represented in the force-velocity curve.
This has led to the development of the Strength-Velocity Continuum, as displayed below in Table 5, and originally presented as the Strength Continuum by Bosco in 1995 at the Collegiate Strength & Conditioning Coaches Association in Salt Lake City, USA (39). Since its initial presentation, this continuum has been developed with the use of velocity-based training (40).
Table 5 shows that when the load gets heavier, and the percentage of 1RM reaches closer to the athlete’s 1RM, the velocity slows. It also displays the physical qualities being trained when an athlete is training at a particular percentage of their 1RM and the corresponding velocity. The distinguishability of traits on the continuum using the velocity of movement has been one of the major advantages of velocity-based training.
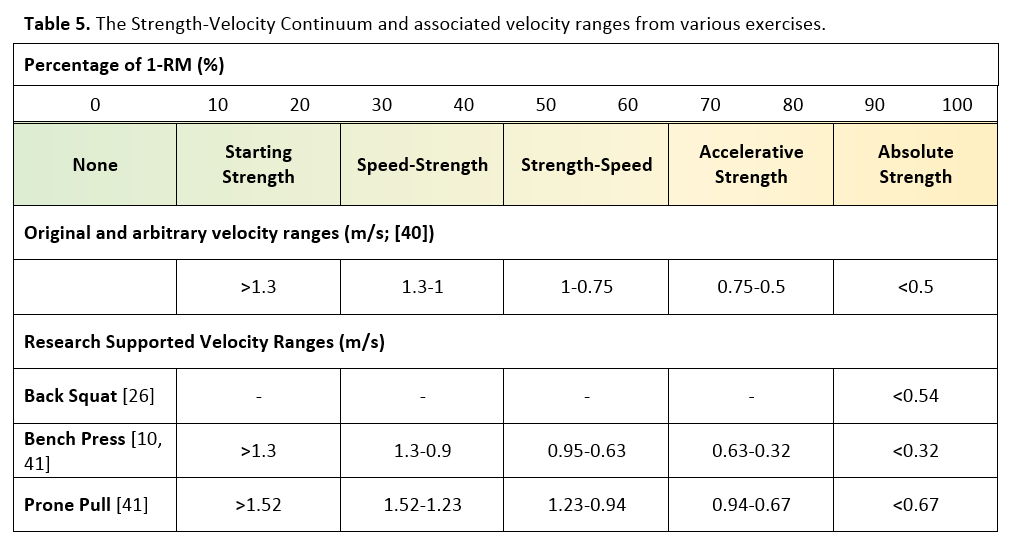
So if the coach wishes to develop an athlete’s “absolute strength” in the back squat, they may prescribe a load which equates 90-100 % of their 1RM, or a maximum velocity of 0.5 m/s or less. Likewise, if they wished to enhance the “speed-strength” quality of the athlete, they may prescribe a load relative to 30-40 % of their 1RM or 1.3-1 m/s.
Whilst this is a very useful guide, and the velocities can be seen as ‘normal/typical’ for those percentages of 1RM, it is important to understand that these speeds, are of course, not completely accurate for every athlete. They may differ for several reasons, such as:
- Strength and power capacity of the athlete
- The exercise being performed (as apparent in Table 4)
- Accuracy of the velocity training device (e.g. accelerometer or linear position transducer)
Having said this, based on the current research and anecdotal evidence presented by industry experts, it appears that the velocities for each zone do not vary a great deal from those numbers presented in Table 4. Understanding these velocity ranges for a variety of different exercises, including the strength and power capabilities of your athletes, allows the coach to identify and target specific training qualities (e.g. absolute strength or strength-speed).
Conclusion
Thanks to recent developments in technology, and some very intelligent individuals within the sports science industry, velocity-based training has evolved strength and conditioning, and potentially for the better. Although this technology may do justice for the industry, it may also do harm if it distracts coaches and subtracts from their session delivery.
There are many ways in which practitioners can incorporate this technology into their coaching structure, but it is strongly advised that coaches do not become over-fixated on this technology and neglect the fundamental aspects of coaching.
Some of these fundamental aspects include: personally watching the technical execution of exercises, verbal feedback, building and maintaining coach-athlete relationships, and the many other ways in which the devices may interfere with the primary role of the practitioner. Providing coaches do not get distracted by the technology, then velocity-based training can add significant value to any coaching programme.
- Fundamentals of Special Strength-Training in Sport: Yuri V. Verkhoshansky: Amazon.com: Books. 2017. Fundamentals of Special Strength-Training in Sport: Yuri V. Verkhoshansky: Amazon.com: Books. [ONLINE] Available at: https://www.amazon.com/Fundamentals-Special-Strength-Training-Sport-Verkhoshansky/dp/B000FFIT26. [Accessed 10 May 2017]
- dynamicfitnessequipment.com. 2017. The Training of the Weightlifter R. A. Roman. [ONLINE] Available at: https://www.dynamicfitnessequipment.com/product-p/sp109.htm. [Accessed 10 May 2017].
- dynamicfitnessequipment.com. 2017. Managing the Training of Weightlifters, N. P. Laputin. [ONLINE] Available at: https://www.dynamicfitnessequipment.com/product-p/sp107.htm. [Accessed 10 May 2017].
- Historic Performance. 2017. Historic Performance Podcast #10 – Dr. Bryan Mann — Historic Performance. [ONLINE] Available at: http://www.historicperformance.net/podcast-episodes//historic-performance-podcast-10-dr-bryan-mann. [Accessed 10 May 2017].
- Jovanovic M, and Flanagan EP. (2014). Researched applications of velocity based strength training. J. Aust. Strength Cond. 22(2)58-69. https://www.researchgate.net/publication/265227430_Researched_Applications_of_Velocity_Based_Strength_Training
- org – The Official Site of the NCAA. 2017. Velocity Based Training | NCAA.org – The Official Site of the NCAA. [ONLINE] Available at: http://www.ncaa.org/health-and-safety/sport-science-institute/velocity-based-training. [Accessed 09 May 2017].
- Zourdos MC, Dolan C, Quiles JM, Klemp A, Jo E, Loenneke JP, Blanco R, Whitehurst M. Efficacy of daily 1RM training in well-trained powerlifters and weightlifters: a case series. Nutr Hosp 2016;33:437-443. https://www.researchgate.net/publication/284179354_Efficacy_of_Daily_1RM_Training_in_Well-Trained_Powerlifters_and_Weightlifters_A_Case_Series
- Flanagan E. (2016) Recent trends & future directions in velocity based strength training. [ONLINE] Available at: https://www.researchgate.net/profile/Eamonn-Flanagan/publication/265227430_Researched_Applications_of_Velocity_Based_Strength_Training/links/543690a60cf2dc341db35e79/Researched-Applications-of-Velocity-Based-Strength-Training.pdf. [Accessed 05 January 2017].
- 2017. Dr Mike Young Advantages of Velocity Based Training – YouTube. [ONLINE] Available at: https://www.youtube.com/watch?v=od3W495fcyg. [Accessed 09 May 2017].
- González-Badillo, J.J., Sánchez-Medina, L. Movement velocity as a measure of loading intensity in resistance training. International Journal of Sports Medicine. 31: 347 – 352. 2010. https://www.ncbi.nlm.nih.gov/pubmed/20180176
- Bosquet, L., Porta-Benache, J., Blais, J. Validity of a commercial linear encoder to estimate bench press 1RM from the force-velocity relationship. Journal of Sport Science and Medicine. 9: 459-463. 2010. https://www.ncbi.nlm.nih.gov/pmc/articles/PMC3761713/
- Banyard, HG, Nosaka, K, and Haff, GG. Reliability and validity of the load–velocity relationship to predict the 1RM back squat. J Strength Cond Res 31(7): 1897–1904, 2017. https://www.ncbi.nlm.nih.gov/labs/articles/27669192/
- Elliott, B.C., Wilson, G.J., & Kerr, G.K. (1989). A biomechanical analysis of the sticking region in the bench press. Medicine and Science in Sports and Exercise, 21, 450-462. https://www.ncbi.nlm.nih.gov/pubmed/2779404
- Wilson GJ, Elliot BC, and Kerr GK. (1989) Bar path and force profile characteristics for maximal and submaximal loads in the bench press. International Journal of Sports Biomechanics, 5, 390-402. https://www.researchgate.net/publication/288193404_Bar_Path_and_Force_Profile_Characteristics_for_Maximal_and_Submaximal_Loads_in_the_Bench_Press
- Turner, A.N. & Jeffreys, I. (2010). The stretch-shortening cycle: proposed mechanisms and methods for enhancement. Journal of Strength and Conditioning Research, 17, 60-67. http://journals.lww.com/nsca-scj/Abstract/2010/08000/The_Stretch_Shortening_Cycle__Proposed_Mechanisms.10.aspx
- Cronin, J.B., McNair, P.J. and Marshall, R.N. Force-velocity analysis of strength-training techniques and load: implications for training strategy and research. Journal of Strength and Conditioning Research. 17: 148-155. 2003. https://www.ncbi.nlm.nih.gov/pubmed/12580670
- Jidovtseff, B., Harris, N.K.., Crielaard, J.M., Cronin, J.B. Using the load-velocity relationship for 1RM prediction. Journal of Strength and Conditioning Research. 25: 267-270. 2011. https://www.ncbi.nlm.nih.gov/pubmed/19966589
- Sanchez-Medina, L., Perez, C.E., Gonzalez-Badillo, J.J. Importance of the propulsive phase in strength assessment. International Journal of Sports Medicine. 31: 123 – 129. 2010. https://www.ncbi.nlm.nih.gov/pubmed/20222005
- Picerno et al. (2016) 1RM prediction: a novel methodology based on the force–velocity and load–velocity relationships. Eur J Appl Physiol. https://www.ncbi.nlm.nih.gov/pubmed/27577950
- Loturco, I, Pereira, LA, Cal Abad, CC, Gil, S, Kitamura, K, Kobal, R, and Nakamura, FY. Using the bar-velocity to predict the maximum dynamic strength in the half-squat exercise. Int J Sports Physiol Perform 11: 697–700, 2016. https://www.ncbi.nlm.nih.gov/pubmed/26457921
- Loturco, I, Kobal, R, Moraes, JE, Kitamura, K, Cal Abad, CC, Pereira, LA, and Nakamura, FY. Predicting the maximum dynamic strength in bench press: the high precision of the bar velocity approach. J Strength Cond Res 31(4): 1127– 1131, 2017. https://www.researchgate.net/publication/308415612_Predicting_The_Maximum_Dynamic_Strength_In_Bench-Press_The_High-Precision_Of_The_Bar-Velocity_Approach
- Ripley N & McMahon JJ. Validity and Reliability of the PUSH Wearable Device to Measure Velocity and Power During Loaded Countermovement Jumps. NSCA Conference Presentation, July 2016. https://www.researchgate.net/publication/305709753_Validity_and_Reliability_of_the_PUSH_Wearable_Device_to_Measure_Velocity_and_Power_During_Loaded_Countermovement_Jumps
- Sánchez-Medina L, González-Badillo JJ, Pérez CE , Pallarés JG. (2013) Velocity- and Power-Load Relationships of the Bench Pull vs. Bench Press Exercises. Int J Sports Med 2014; 35: 209–216. https://www.ncbi.nlm.nih.gov/pubmed/23900903
- Izquierdo M., Gonzalez-Badillo J.J., Häkkinen K., Ibañez J., Kraemer W.J., Altadill A., Eslava J., Gorostiaga E.M. Effect of loading on unintentional lifting velocity declines during single sets of repetitions to failure during upper and lower extremity muscle actions. International Journal of Sports Medicine. 27: 718–724. 2006. https://www.ncbi.nlm.nih.gov/pubmed/16944400
- Pallares et al. Imposing a pause between the eccentric and concentric phases increases the reliability of isoinertial strength assessments. Journal of Sport Sciences. 32:1165-1175. 2014. https://www.ncbi.nlm.nih.gov/pubmed/24575723
- Ormsbee MJ, Carzoli J, Klemp A and Panton LB. Efficacy Of The Repetitions In Reserve-Based Rating Of Perceived Exertion For The Bench Press In Experienced And Novice Benchers. The Journal of Strength and Conditioning Research. Ahead of Print. https://www.researchgate.net/publication/315195335_Efficacy_Of_The_Repetitions_In_Reserve-Based_Rating_Of_Perceived_Exertion_For_The_Bench_Press_In_Experienced_And_Novice_Benchers
- Helms et al. RPE and Velocity Relationships for the Back Squat, Bench Press, and Deadlift in Powerlifters. Journal of Strength and Conditioning Research. 31(2): 292-297. 2017. https://www.ncbi.nlm.nih.gov/pubmed/27243918
- PUSH // Train With Purpose. 2017. Free VBT Guide by Dan Baker // PUSH // Train With Purpose. [ONLINE] Available at: https://www.trainwithpush.com/3-part-vbt-guide/. [Accessed 10 May 2017].
- Zourdos et al. Novel resistance training-specific RPE scale measuring repetitions in reserve. Journal of Strength and Conditioning Research. 30(2): 267–275 2016. https://www.ncbi.nlm.nih.gov/pubmed/26049792
- Randell, AD, Cronin, JB, Keogh, JWL,Gill, ND, and Pedersen, MC. Effect of instantaneous performance feedback during 6 weeks of velocity-based resistance training on sport-specific performance tests. J Strength Cond Res 25(1): 87–93, 2011. https://www.ncbi.nlm.nih.gov/pubmed/21157389
- Keller M, Lauber B, Gottschalk M & Taube W. Enhanced jump performance when providing augmented feedback compared to an external or internal focus of attention. J Sports Sci. 2015;33(10):1067-75. https://www.ncbi.nlm.nih.gov/pubmed/25529245
- Keller, M., Lauber, B., Gehring, D., Leukel, C., & Taube, W. (2014). Jump performance and augmented feedback: Immediate benefits and long-term training effects. Human Movement Science, 36, 177–189. https://www.ncbi.nlm.nih.gov/pubmed/24875045
- PUSH // Train With Purpose. 2017. An Intro to Velocity Based Training // PUSH // Train With Purpose. [ONLINE] Available at: https://www.nsca.com/contentassets/7fc346ec744044b6871541e5a6ee5c63/velocity_based_training__from_theory_to.99257.pdf?srsltid=AfmBOooFORGxfCQ4R1of2R361PiHb8CuHo-gQfTGFgTSth4MftyzL3CP. [Accessed 04 June 2017].
- Mann JB, Thyfault JP, Ivey PA, Sayers SP. The effect of auto-regulatory progressive resistance exercise vs. linear periodization on strength improvement in college athletes. Journal of Strength and Conditioning Research. 24(7): 1718-23. 2010. https://www.ncbi.nlm.nih.gov/pubmed/20543732
- Folland, JP, Irish, CS, Roberts, JC, Tarr, JE and Jones, DA. Fatigue is not a necessary stimulus for strength gains during resistance training. Br J Sports Med 36: 370-74, 2002. https://www.ncbi.nlm.nih.gov/pmc/articles/PMC1724546/
- Angleri V, Ugrinowitsch C, Libardi CA. Crescent pyramid and drop-set systems do not promote greater strength gains, muscle hypertrophy, and changes on muscle architecture compared with traditional resistance training in well-trained men. European Journal of Applied Physiology, pp 1–11. (2017). https://www.ncbi.nlm.nih.gov/pubmed/28130627
- Padulo, J, Mignogna, P, Mignardi, S, Tonni, F and D’Ottavio, S. Effect of different pushing speeds on bench press. Int J Sports Med 33: 376-80, 2012. https://www.ncbi.nlm.nih.gov/pubmed/22318559
- Schoenfeld BJ, Ogborn D, Krieger JW. Dose-response relationship between weekly resistance training volume and increases in muscle mass: A systematic review and meta-analysis. J Sports Sci. 2017 Jun;35(11):1073-1082. https://www.ncbi.nlm.nih.gov/pubmed/27433992
- Morris B. Presented at Collegiate Strength & Conditioning Coaches Association, Salt Lake City, UT, 2005.
- DEVELOPING EXPLOSIVE ATHLETES: USE OF VELOCITY BASED TRAINING IN TRAINING ATHLETES: Bryan Mann: 9781540558824: Amazon.com: Books. 2017. DEVELOPING EXPLOSIVE ATHLETES: USE OF VELOCITY BASED TRAINING IN TRAINING ATHLETES: Bryan Mann: 9781540558824: Amazon.com: Books. [ONLINE] Available at: https://www.amazon.com/DEVELOPING-EXPLOSIVE-ATHLETES-VELOCITY-TRAINING/dp/1540558827. [Accessed 10 May 2017].
- Sánchez-Medina L, González-Badillo, Pérez CE & Pallarés JG. Velocity- and Power-Load Relationships of the Bench Pull vs. Bench Press Exercises. Int J Sports Med 2014; 35: 209–216. https://www.ncbi.nlm.nih.gov/pubmed/23900903
- Sanchez-Medina, L., and J. J. Gonzalez-Badillo. Velocity Loss as an Indicator of Neuromuscular Fatigue during Resistance Training. Med. Sci. Sports Exerc. Vol. 43, No. 9, pp. 1725-1734. 2011. https://www.ncbi.nlm.nih.gov/pubmed/21311352